Candlestick Patterns Every Beginner Trader in India Must Know
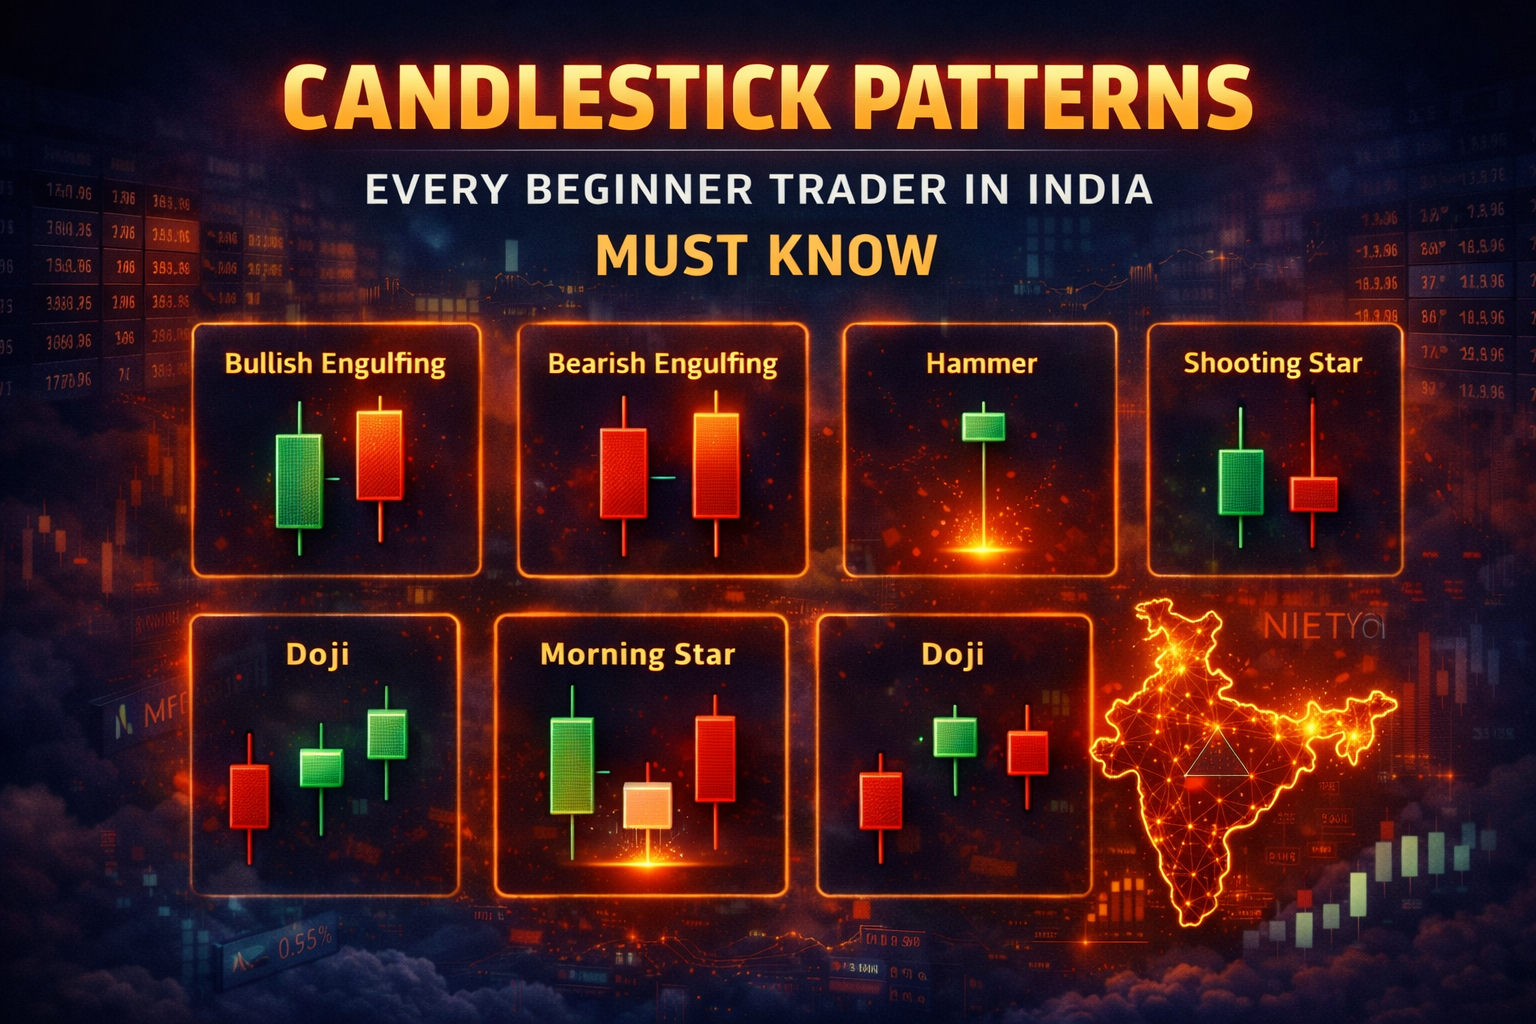
Not 38 patterns dumped in a list. The 10 patterns that actually matter on NSE — with visual diagrams, exact entry/stop/target rules, volume confirmation requirements, and real Nifty & Bank Nifty examples.
Why Most Candlestick Guides Fail Indian Beginners
Search "candlestick patterns for beginners" and you'll find guides listing 30, 38, even 100+ patterns. The implicit message: learn them all. The practical result: overwhelmed beginners who memorise pattern names but have no idea how to trade any of them — no entry rule, no stop-loss, no target, no understanding of when a pattern is valid and when it isn't.
This guide covers exactly 10 patterns. Not because there are only 10, but because these 10 — properly understood and applied — are sufficient to generate consistent trade ideas on NSE daily and 15-minute charts. Every other pattern is a variation or combination of these fundamentals. Master these first.
More importantly, each pattern here comes with what every other guide omits: a visual representation so you can see what it looks like, the exact entry, stop-loss, and target rules for NSE instruments, a volume confirmation requirement, the best timeframe for each on Indian markets, and the conditions under which each pattern fails.
The Golden Rule for All Candlestick Trading: A candlestick pattern is a signal — not a guarantee. It identifies a high-probability setup. Your stop-loss and position sizing determine whether you profit from the edge over time. Always set a stop-loss at the relevant level before entering any candle-based trade. For the full framework on stop-loss placement using option chain data, see our option chain S/R guide.
How to Read a Candlestick — Before Any Pattern
Every candlestick shows four pieces of information for a specific time period: the Open (where price started), the Close (where price ended), the High (the highest point reached), and the Low (the lowest point reached). The rectangular body shows the distance between open and close. The thin lines above and below (wicks or shadows) show the high and low.
Bullish candle (green): Close is higher than Open. Buyers were in control for this period. The body size shows conviction — a large body means strong buying; a small body means weak buying pressure.
Bearish candle (red): Open is higher than Close. Sellers were in control. Large red body = strong selling pressure.
Wicks/shadows: Show price tested those levels but was rejected. A long lower wick means sellers tried to push lower but buyers stepped in. A long upper wick means buyers tried to push higher but sellers stepped in.
With this foundation, every pattern becomes a story — buyers and sellers fighting for control, leaving a visual record of who won each battle. The patterns below tell you who is winning and how convincingly.
Small body near the top of the candle with a long lower wick (at least 2× the body length) and little to no upper wick. Appears at the bottom of a downtrend. The long lower wick shows sellers pushed price down aggressively during the period — but buyers stepped in and pushed it all the way back up before close. Buyers won the battle convincingly.
Mirror image of the Hammer — small body near the bottom of the candle with a long upper wick (2× body length minimum) and little to no lower wick. Appears at the top of an uptrend. Buyers pushed price up sharply during the period, but sellers overwhelmed them and pushed it back down before close. Sellers won convincingly at the top.
Open and close are at virtually the same price — producing a tiny or non-existent body with wicks on both sides. The market could not establish a winner between buyers and sellers. A Doji doesn't signal direction — it signals exhaustion of the current trend. After a strong uptrend a Doji warns bulls are losing conviction; after a strong downtrend it warns bears are losing control. Always wait for the next candle to confirm direction.
A candle with a very large body and virtually no wicks on either side. Bullish Marubozu: opened at the low and closed at the high — buyers were completely dominant throughout the entire period, never letting price dip from open. Bearish Marubozu: opened at the high and closed at the low — sellers dominated completely. It signals extreme one-sided conviction and is one of the strongest momentum signals in candlestick analysis.
A small bearish (red) candle is followed by a larger bullish (green) candle whose body completely engulfs the previous red candle's body. Appears at the bottom of a downtrend. The green candle must open below the previous red close and close above the previous red open. This pattern shows that buyers came in decisively and overwhelmed the sellers — a strong reversal signal, especially when the engulfing candle is large.
The exact mirror of Bullish Engulfing — a small green candle is completely engulfed by a larger red candle. Appears at the top of an uptrend. The red candle opens above the previous green close and closes below the previous green open. Signals that sellers stepped in decisively and overwhelmed buyers. One of the most reliable bearish reversal signals in Indian markets when it appears at option chain Call OI resistance.
A large bearish (red) candle is followed by a small bullish (green) candle whose body is entirely contained within the previous red candle's body — "harami" means pregnant in Japanese. The small inside candle signals that sellers are losing momentum — but it's a weaker signal than Engulfing patterns. Always requires a strong next-candle confirmation before acting. The Bearish Harami is the mirror pattern at an uptrend top.
Three-candle pattern at the bottom of a downtrend. First: a large red candle confirming the downtrend. Second: a small-bodied candle (star) that gaps down — representing indecision as sellers lose momentum. Third: a large green candle that closes well into the first red candle's body, confirming that buyers have taken control. The three-candle sequence tells the complete story: sellers dominate → neither side wins → buyers take control decisively.
Mirror of the Morning Star — appears at the top of an uptrend. First: a large green candle confirming the uptrend. Second: a small star candle that gaps up — buyers are still trying, but momentum is waning. Third: a large red candle that closes well into the first green candle's body, confirming sellers have taken control. Among the most reliable bearish reversal patterns, particularly powerful at option chain Call OI resistance levels in Indian markets.
Three consecutive large bullish (green) candles, each opening within the previous candle's body and closing progressively higher, with small or no wicks. Signals powerful sustained buying momentum — institutions are systematically accumulating over multiple sessions. The pattern is both a reversal signal after a downtrend and a continuation signal in an established uptrend. Its bearish counterpart, Three Black Crows, is three consecutive red candles closing progressively lower.
5 Rules That Apply to Every Candlestick Pattern
These five rules apply regardless of which pattern you trade. They are what separate traders who use candlesticks profitably from those who use them as a gambling framework.
| Rule | What It Means in Practice |
|---|---|
| 1. Context Is Everything | A Hammer at the bottom of a 10-session downtrend is powerful. A Hammer in the middle of a sideways range is noise. Always identify the trend first — patterns only have meaning in trend context. |
| 2. Volume Confirms or Invalidates | Every reversal pattern requires higher-than-average volume on the reversal candle. Low-volume patterns are unreliable. Rule of thumb: reversal candle volume should be ≥1.5× the 20-candle average. |
| 3. Combine with S/R Levels | Patterns appearing at option chain OI support/resistance levels are 2–3× more reliable than patterns appearing in empty price space. A Bullish Engulfing at a 24,000 Put OI support is a far stronger signal than the same pattern at 24,350 with no level. |
| 4. Always Wait for Confirmation | Single-candle patterns (Doji, Hammer) require the next candle to confirm before entry. Two-candle patterns are stronger but still benefit from next-session confirmation. Three-candle patterns like Morning/Evening Star can be acted on at the close of the third candle. |
| 5. Stop-Loss Is Non-Negotiable | Every candlestick pattern has a defined invalidation level — the price at which the pattern's thesis is wrong. That level is your stop-loss. No exceptions. Pattern fail rates range from 30–45%; without a stop-loss, the losing trades are uncontrolled and will erase multiple winners. |
Which Timeframe Should You Use on NSE?
The same pattern on different timeframes carries completely different reliability. A Hammer on a 1-minute Nifty chart is noise. The same Hammer on a daily Nifty chart is a meaningful signal. Here's the practical guide for Indian retail traders:
| Timeframe | Pattern Reliability | Best Used By | Key Context |
|---|---|---|---|
| Weekly Chart | Highest | Positional / Swing traders (1–4 week holds) | Major reversals. Morning/Evening Star and Three White Soldiers/Black Crows on weekly = powerful institutional signal |
| Daily Chart | Very High | Swing traders (3–10 day holds) | Recommended starting timeframe for all beginners. Each candle = one trading session. Most patterns from this guide are taught for daily charts. |
| 15-Minute Chart | Moderate–High | Intraday traders on Nifty / Bank Nifty | Best intraday timeframe for Indian markets. Patterns here are reliable when they align with daily chart trend direction and option chain S/R levels. |
| 5-Minute Chart | Moderate | Active intraday traders | Patterns less reliable than 15-min. Only use 5-min patterns when they align with the 15-min and daily trend. Never use in isolation. |
| 1–3 Minute Chart | Low (for beginners) | Advanced scalpers only | At 1–3 min timeframes, institutional algo activity dominates. Patterns form and fail instantly. Not suitable for beginner candlestick application. |
The Multi-Timeframe Confirmation Rule: The most reliable candlestick trade signals occur when the daily chart and 15-minute chart both show the same pattern direction simultaneously. A Bullish Engulfing on the daily chart + Hammer on the 15-minute chart at the same price level = very high-confidence long signal. Practise identifying multi-timeframe confluences on Stoxra's advanced charts with live NSE data.
Spot Every Pattern on Live Nifty Charts — Free
Reading about candlestick patterns and recognising them on live charts under market pressure are two completely different skills. Stoxra's platform gives you everything to practise both — advanced charts with 50+ indicators on live NSE/BSE data, a paper trading simulator with ₹10 lakh virtual capital, and an AI Mentor that explains any pattern you spot and its trading implications.
50+ indicators. Live Nifty, Bank Nifty, and NSE stock data. Practise spotting all 10 patterns on real price action — not textbook examples.
Spot a pattern, place a paper trade with a stop-loss and target. Track the outcome. ₹10L virtual capital, live data, no time limits.
Ask the AI Mentor to explain any candle pattern you see on a live chart — in plain language with India-specific context.
Confirm every pattern against option chain OI support/resistance levels — the integration that makes candlestick signals dramatically more reliable.
Track your candlestick pattern win rate per pattern type — discover which patterns work best in your trading style.
Structured courses that take you from pattern recognition to complete trade setups with entry, stop, and target rules.
Frequently Asked Questions
The most important patterns for Indian beginners are: Single candle — Hammer (bullish reversal at downtrend bottom), Shooting Star (bearish reversal at uptrend top), Doji (indecision/trend exhaustion warning), Marubozu (strong one-sided momentum). Two-candle — Bullish Engulfing, Bearish Engulfing, Bullish Harami. Three-candle — Morning Star (strong bullish reversal), Evening Star (strong bearish reversal), Three White Soldiers (powerful bullish momentum). Learn them in this order, always confirm with volume, and practise on a paper simulator before using them in live NSE trades.
Candlestick patterns are not standalone trade signals — they are probability-enhancers. On their own, even the most reliable patterns (like Bullish Engulfing near support) have 55–65% historical accuracy on NSE daily charts. Reliability increases significantly when combined with volume confirmation (≥1.5× average on the reversal candle), alignment with option chain OI support/resistance levels, and the broader market trend direction. Never trade a candlestick pattern without a stop-loss placed at the pattern's invalidation level.
For Indian retail traders: daily charts are the most reliable timeframe for candlestick patterns. Daily candles carry more significance and are less affected by intraday algorithmic noise. For intraday traders, 15-minute charts offer the best balance of signal quality and frequency on Nifty and Bank Nifty. Avoid using candlestick patterns on 1-minute or 3-minute charts — at these timeframes, institutional AI activity dominates and patterns form and fail within seconds, making them unreliable for manual traders.
A Doji is a candlestick where the opening and closing price are virtually the same, creating a tiny or non-existent body with wicks on both sides. It represents market indecision — neither buyers nor sellers established control. A Doji is most significant when it appears after a strong trend: after a strong uptrend it signals that bullish momentum is fading; after a strong downtrend it signals that selling pressure is exhausting. Always wait for the next candle to confirm direction before acting on a Doji — it is a warning signal, not an entry signal on its own.
Both have a small body and a long wick — but they signal opposite things at opposite points in a trend. A Hammer appears at the bottom of a downtrend: small body at the top, long lower wick (buyers pushed price back up after sellers drove it down) — signals potential bullish reversal. A Shooting Star appears at the top of an uptrend: small body at the bottom, long upper wick (sellers pushed price back down after buyers drove it up) — signals potential bearish reversal. The key distinction is location in the trend, not just the shape of the candle.
10 Patterns Is Enough — What Matters Is How You Apply Them
You now have the 10 candlestick patterns that appear most consistently on NSE and BSE charts, each with a visual representation, exact entry and stop-loss rules, volume confirmation requirements, and the conditions under which each pattern fails. This is more actionable information per pattern than most guides give across 38 patterns.
The most common mistake after learning candlestick patterns is over-trading them — seeing patterns everywhere and treating every formation as a trade signal. The discipline is to wait for the patterns that have all four confirmations simultaneously: the right trend context, sufficient volume, alignment with an option chain S/R level, and a risk/reward of at least 1.5:1. When all four align, act decisively with a clearly defined stop-loss. When they don't, don't trade.
Start with Tier 1 — practise spotting Hammers, Shooting Stars, Dojis, and Marubozus on Stoxra's live Nifty charts daily. When you can reliably identify them in real-time without referring back to this guide, add Tier 2. Then Tier 3. This structured progression — not memorising all 10 at once — is what builds the pattern recognition skill that becomes automatic over time.
Spot These Patterns on Live NSE Charts — Free on Stoxra
Advanced charts with live Nifty and Bank Nifty data, AI Mentor feedback, option chain OI confirmation, and ₹10 lakh paper trading — everything to turn pattern knowledge into practised skill.