Ichimoku Cloud Strategy: A Beginner's Guide
The Ichimoku Cloud is a multi-component technical analysis indicator used to study trend, momentum, support and resistance. Learn how each component works and how beginners can interpret the indicator.
Ichimoku Cloud Strategy: A Beginner's Guide
Technical analysis offers traders many indicators for studying price trends, momentum and potential support and resistance levels. The Ichimoku Cloud is one of the more comprehensive indicators because it combines several calculations into a single visual framework.
Unlike an indicator that focuses on only one aspect of price action, the Ichimoku system can provide information about trend direction, momentum, potential support and resistance, and the relationship between current price and historical price levels.
This guide explains the Ichimoku Cloud strategy in simple terms, including its five components, how the cloud is interpreted, common bullish and bearish signals, and mistakes beginners should avoid.
Key Takeaway
The Ichimoku Cloud is not just a single line. It is a complete indicator made up of five components that work together to provide information about trend, momentum and potential support and resistance. Beginners should understand each component before attempting to build a trading strategy around it.
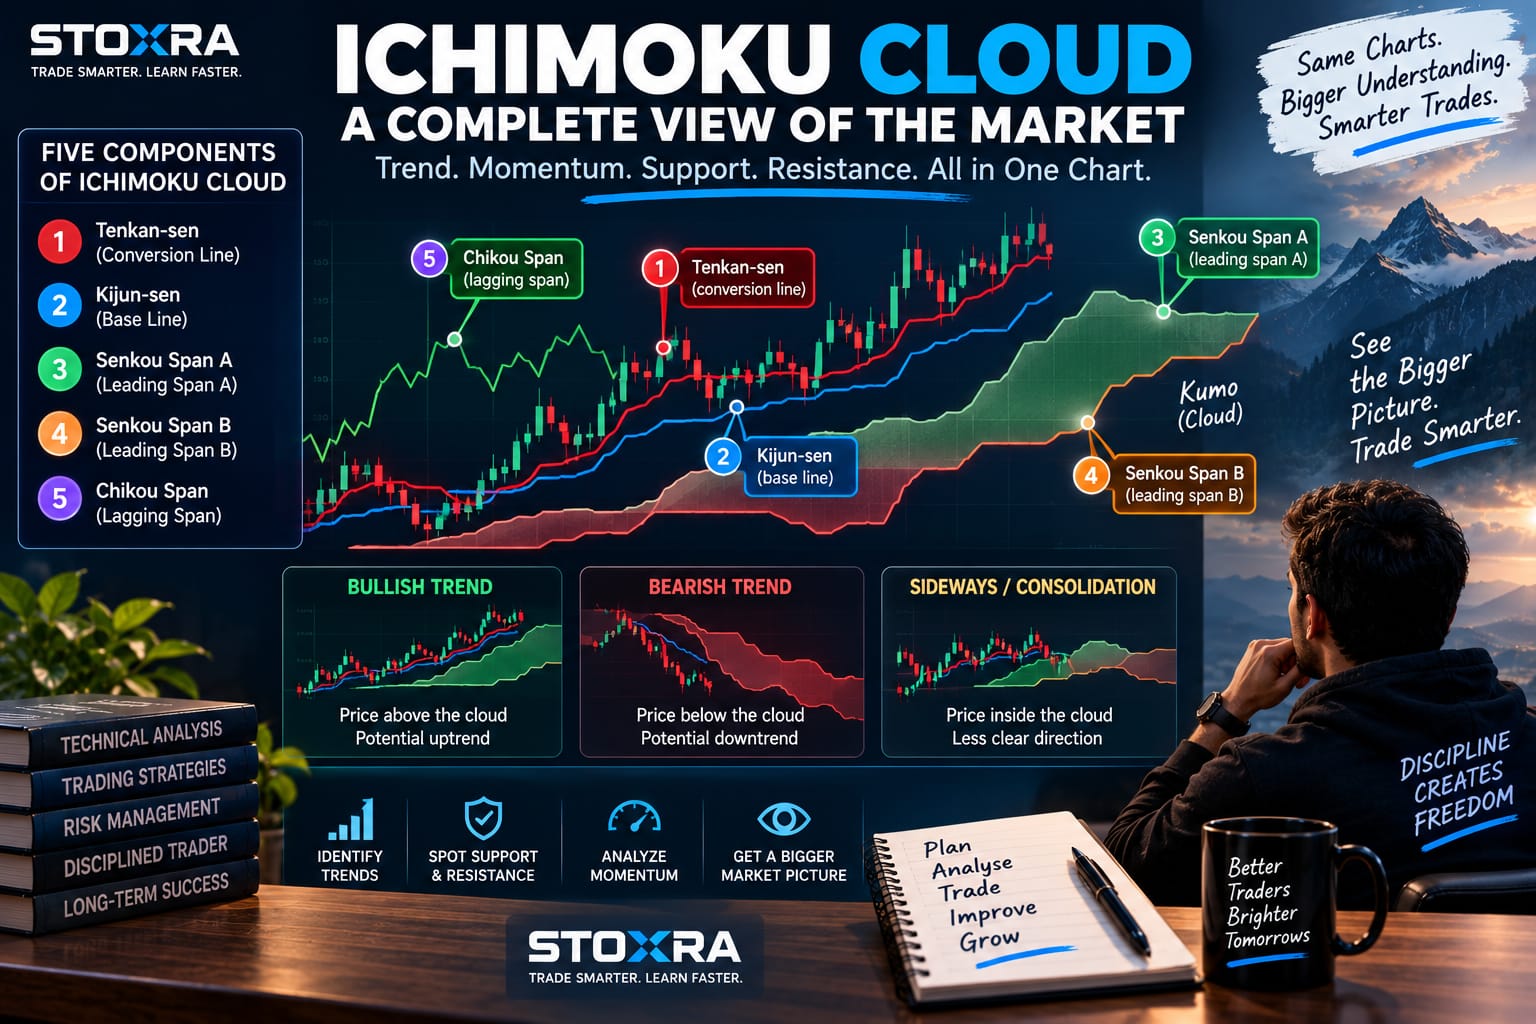
What Is the Ichimoku Cloud?
The Ichimoku Cloud, commonly called Ichimoku Kinko Hyo, is a technical analysis indicator developed in Japan. Its design allows traders to observe several aspects of market behavior from the same chart.
The word “Ichimoku” can be broadly associated with seeing the market “at a glance.” The indicator attempts to provide a broader view of price structure rather than relying on a single signal.
The most recognizable part of the indicator is the shaded area called the Kumo, or cloud. However, the cloud is only one part of the complete Ichimoku system.
The indicator is commonly used on stocks, indices, currencies and other actively traded markets, although the effectiveness of any technical indicator can vary depending on the asset, timeframe and market conditions.
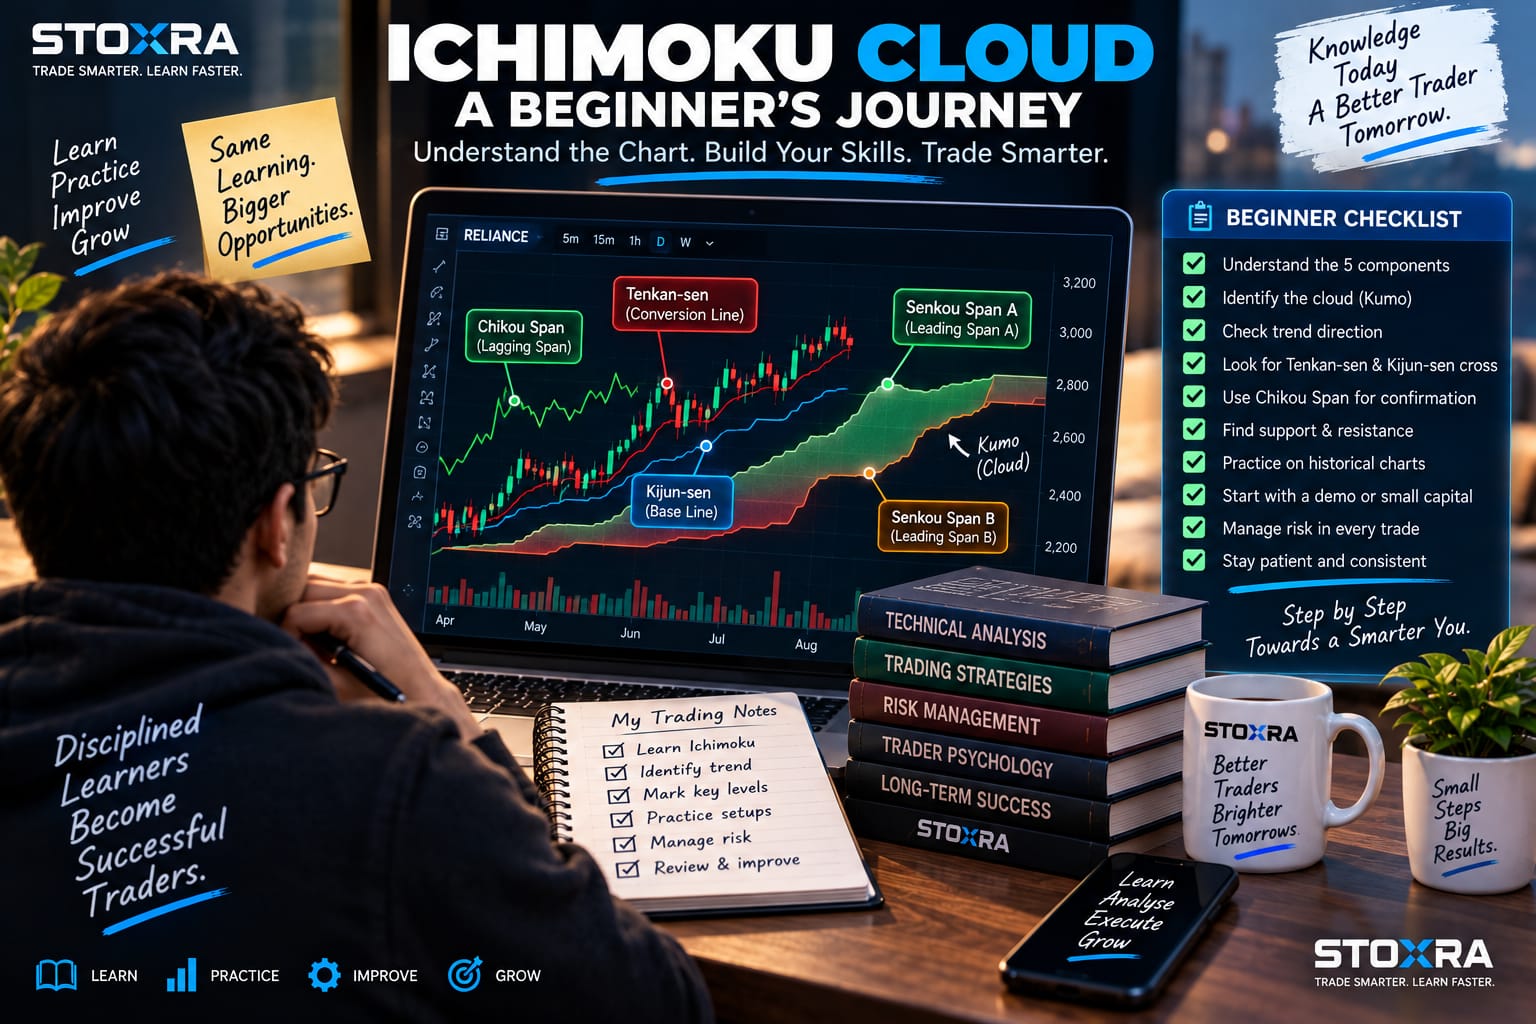
The Five Components of the Ichimoku Indicator
Understanding the five components is the foundation of an effective Ichimoku Cloud strategy.
1. Tenkan-sen
The Tenkan-sen, also called the Conversion Line, is commonly calculated using the midpoint of the highest high and lowest low over the previous nine periods.
2. Kijun-sen
The Kijun-sen, or Base Line, is commonly calculated using the midpoint of the highest high and lowest low over the previous 26 periods.
3. Senkou Span A
Senkou Span A is calculated from the average of the Tenkan-sen and Kijun-sen and is plotted forward by 26 periods.
4. Senkou Span B
Senkou Span B is commonly calculated from the midpoint of the highest high and lowest low over 52 periods and is also plotted forward by 26 periods.
5. Chikou Span
The Chikou Span, or Lagging Span, represents the current closing price plotted backward by 26 periods.
What Is the Ichimoku Cloud?
The area between Senkou Span A and Senkou Span B forms the Ichimoku Cloud, also known as the Kumo.
Traders often use the cloud as a visual representation of potential support and resistance and the broader trend environment.
When price is above the cloud, traders may interpret the market environment as relatively bullish. When price is below the cloud, the environment may be interpreted as relatively bearish. When price moves inside the cloud, the market may be considered less clearly directional.
These interpretations are not guarantees. Price can move through the cloud, reverse unexpectedly or remain within it for extended periods.
How the Ichimoku Cloud Shows Trend Direction
One of the major strengths of the Ichimoku system is that it provides a visual way to study trend direction.
A simplified interpretation is:
- Price above the cloud: potentially bullish environment.
- Price below the cloud: potentially bearish environment.
- Price inside the cloud: potentially less decisive or transitional environment.
Traders can combine this information with the position of the Tenkan-sen, Kijun-sen and Chikou Span to assess whether different parts of the indicator support the same market view.
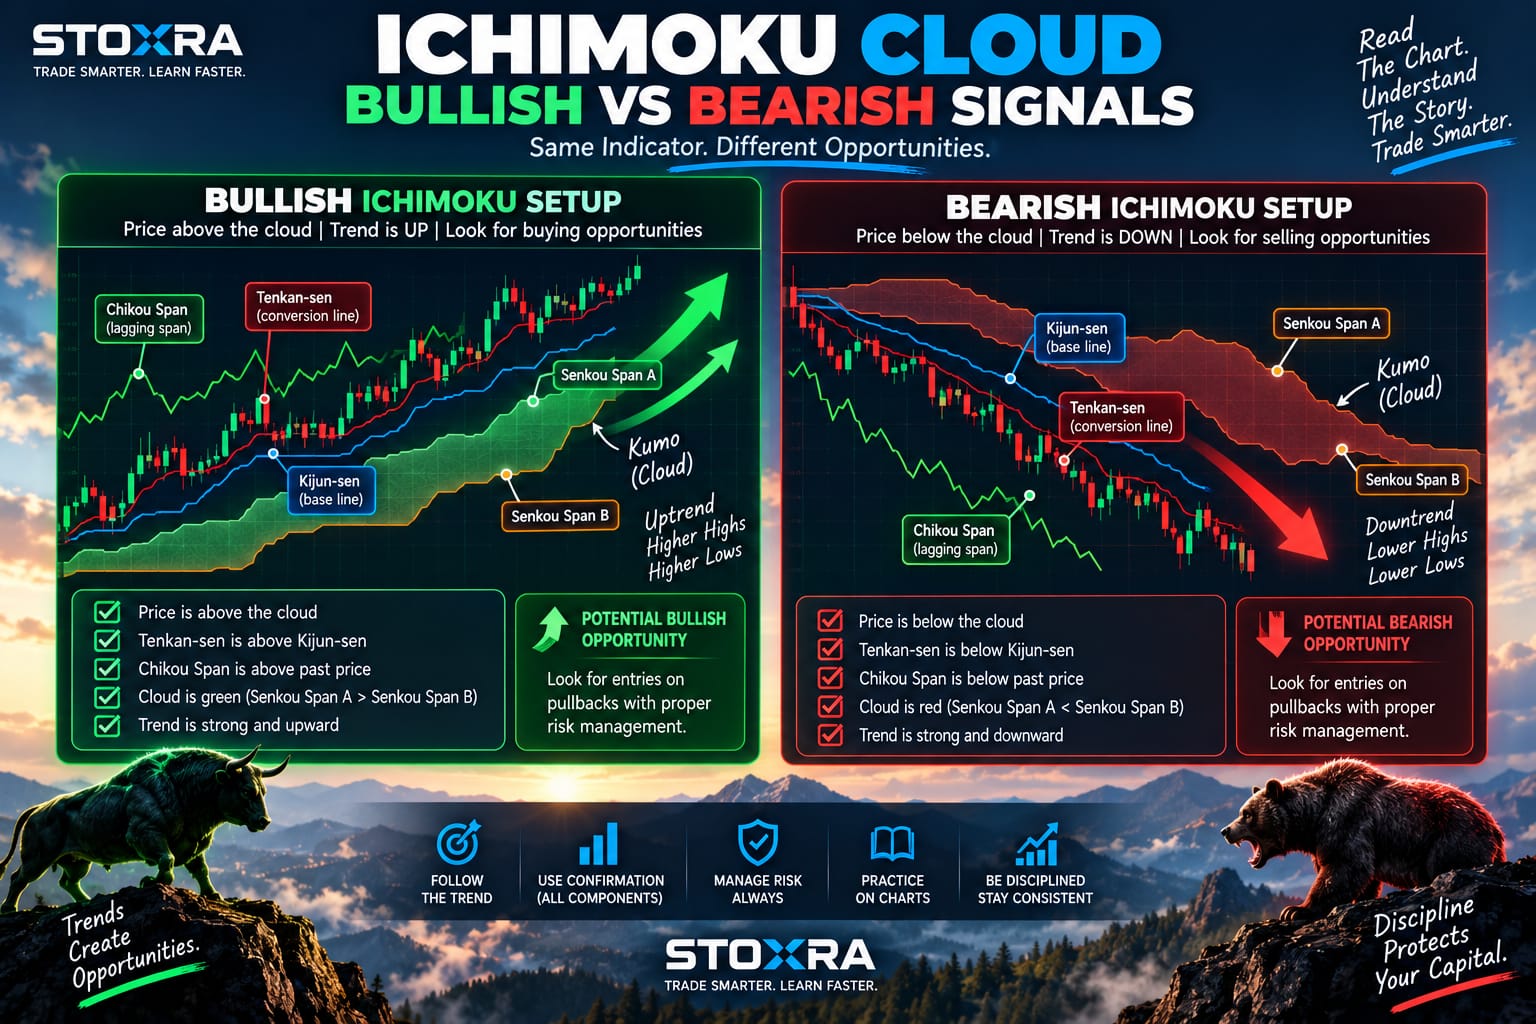
Tenkan-sen and Kijun-sen Crossovers
The relationship between the Tenkan-sen and Kijun-sen is another commonly watched part of the indicator.
Bullish Crossover
A bullish crossover occurs when the Tenkan-sen moves above the Kijun-sen. Traders may consider the signal stronger when it occurs above the cloud, although no technical signal should be treated as certain.
Bearish Crossover
A bearish crossover occurs when the Tenkan-sen moves below the Kijun-sen. Traders may give greater weight to such a signal when it occurs below the cloud.
The location of the crossover relative to the cloud can therefore add context to the signal rather than relying on the crossover alone.
How to Read a Bullish Ichimoku Setup
A bullish Ichimoku setup generally involves several pieces of evidence pointing in the same direction.
A trader may look for price trading above the cloud, a Tenkan-sen above the Kijun-sen, and a Chikou Span that supports the bullish interpretation.
Some traders also examine whether the cloud ahead is bullish and whether the projected structure supports the broader trend.
Pro Tip
Avoid treating one Ichimoku line crossing another as a complete trading system. Stronger analysis comes from looking at the relationship between price, the cloud, Tenkan-sen, Kijun-sen and broader market structure.
How to Read a Bearish Ichimoku Setup
A bearish setup can be interpreted using the opposite conditions.
- Price is trading below the cloud.
- Tenkan-sen is below the Kijun-sen.
- Chikou Span supports the bearish market structure.
- The projected cloud may also show a weaker structure.
Again, these are analytical signals rather than guarantees. Markets can reverse, consolidate or produce false signals.
Ichimoku Cloud as Support and Resistance
The cloud can also be used to identify potential areas where price may encounter support or resistance.
In an uptrend, traders may observe whether the cloud or other Ichimoku levels act as potential support during pullbacks.
In a downtrend, traders may monitor whether the cloud acts as potential resistance when price attempts to recover.
These levels should not be treated as exact barriers. Market price can move through technical levels, particularly during high volatility or significant news events.
Beginners who want to understand broader chart-reading concepts can also explore STOXRA's guide on What Is Technical Analysis in Stock Trading? .
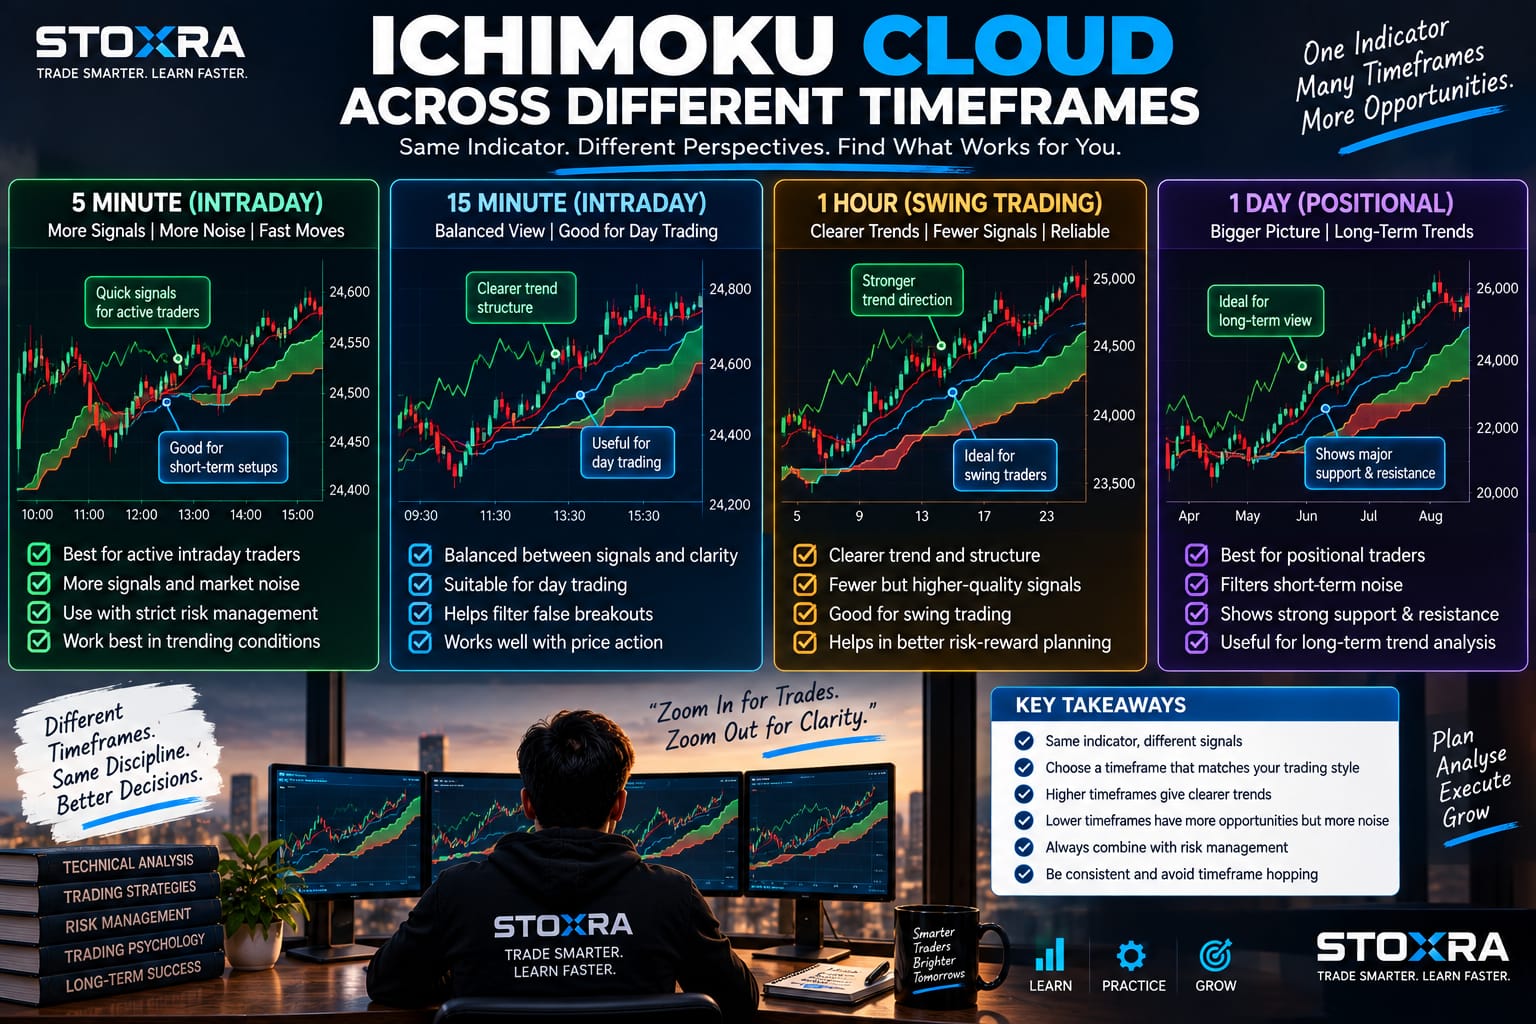
Ichimoku Cloud and Different Timeframes
The Ichimoku indicator can be applied to different chart timeframes, but signals can vary significantly between short-term and long-term charts.
An intraday chart may generate more signals but can also contain more market noise. A higher timeframe may provide a broader view of trend structure but fewer trading opportunities.
Traders should therefore choose a timeframe that matches their trading style and avoid switching between timeframes simply to find a signal that supports an existing opinion.
Simple Ichimoku Cloud Strategy for Beginners
Beginners can start by using the indicator as a trend-filtering framework rather than attempting to trade every crossover.
Step 1: Identify the Cloud Position
First determine whether price is above, below or inside the cloud.
Step 2: Check Tenkan-sen and Kijun-sen
Look at whether the shorter-term Tenkan-sen is above or below the Kijun-sen.
Step 3: Examine the Chikou Span
Use the Chikou Span as additional context rather than treating it as an independent buy or sell trigger.
Step 4: Study Price Structure
Check recent highs, lows, trend structure and important support or resistance areas.
Step 5: Define Risk Before Entry
If the analysis leads to a trade setup, determine the invalidation level and position size before entering.
Ichimoku Cloud Strategy Example
Consider a hypothetical stock trading above the Ichimoku Cloud.
The Tenkan-sen is also above the Kijun-sen, while the broader price structure shows higher highs and higher lows. The Chikou Span does not contradict the bullish interpretation.
A trader may consider this a stronger bullish environment than a situation where price is inside the cloud and the Tenkan-sen and Kijun-sen are repeatedly crossing.
The example does not mean the stock must rise. It simply demonstrates how multiple pieces of information can be evaluated together.
Ichimoku Cloud vs Traditional Moving Averages
| Ichimoku Cloud | Traditional Moving Average |
|---|---|
| Uses multiple components. | Usually focuses on one smoothed price series. |
| Provides trend and potential support/resistance context. | Often used primarily to identify trend direction. |
| Includes a forward-projected cloud. | Normally does not create a projected cloud. |
| Can look visually complex to beginners. | Generally easier to understand initially. |
| Combines several time-based calculations. | Uses a selected averaging period. |
Common Mistakes Beginners Make With Ichimoku
1. Using Every Signal Independently
The indicator is designed as a complete system. Taking one crossover without considering the cloud and price structure can create misleading conclusions.
2. Ignoring Market Conditions
Trend-following indicators may behave differently in strongly trending markets compared with sideways markets.
3. Treating Signals as Guaranteed
Technical indicators are analytical tools. They cannot predict every future price movement.
4. Overcomplicating the Chart
Adding numerous additional indicators can make the chart harder to interpret rather than improving decision quality.
5. Ignoring Risk Management
A technically attractive setup can still fail. Position sizing and predefined risk limits remain important.
Important Warning
The Ichimoku Cloud does not guarantee profitable trades. Technical signals can fail because of volatility, sudden news, market gaps, changing trends and other factors. Always combine technical analysis with appropriate risk management.
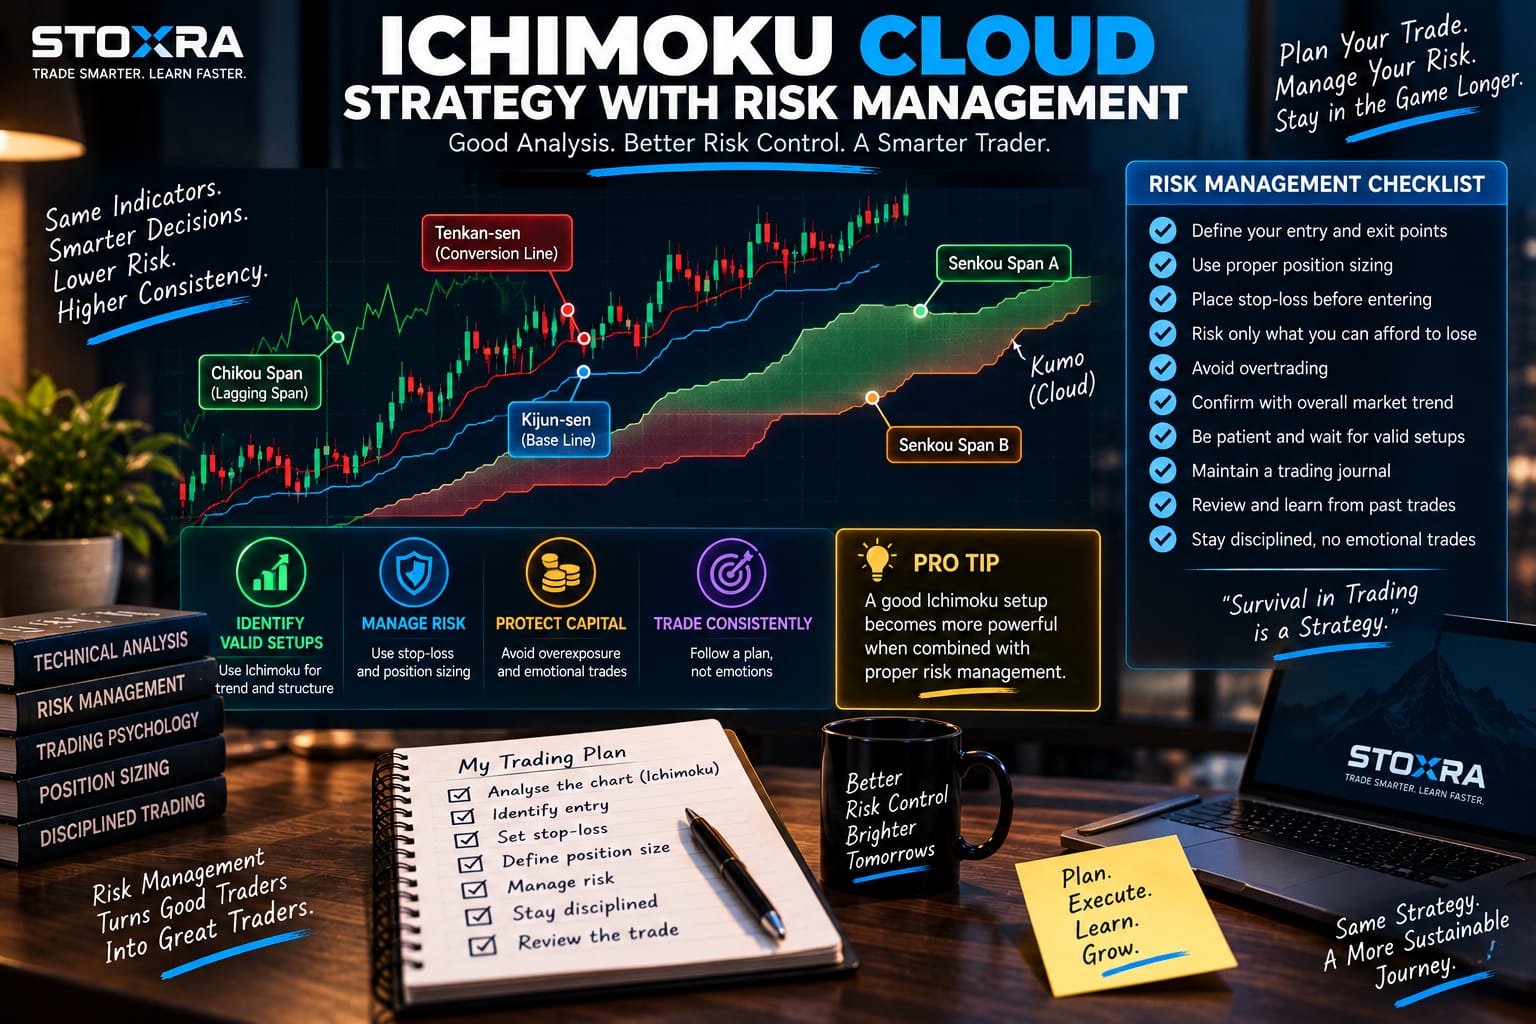
Ichimoku Cloud and Risk Management
Technical analysis can help identify potential trade setups, but risk management determines how much capital is exposed when a setup fails.
Before entering a trade, traders should consider position size, potential loss, stop-loss placement and the overall risk of the strategy.
A useful resource for beginners is STOXRA's Intraday Risk Management Guide .
Traders can also learn more about position sizing before applying an Ichimoku-based strategy to an actual trading account.
How to Combine Ichimoku With Price Action
Some traders use Ichimoku alongside basic price-action analysis rather than relying entirely on indicator signals.
This can include observing support and resistance, swing highs and lows, breakout structures, trendlines and candle behavior.
For example, a trader may give more attention to a bullish Ichimoku setup when price is also holding an important support level and creating a higher-low structure.
The objective is not to collect as many indicators as possible. The objective is to create a clear decision-making process.
When the Ichimoku Cloud May Give Weak Signals
No indicator performs equally well in every market environment.
During sideways or highly choppy markets, the Tenkan-sen and Kijun-sen can cross repeatedly, while price may move above and below the cloud several times.
Such conditions can produce multiple signals without a sustained trend.
Traders should therefore identify the broader market environment before deciding whether a trend-following approach is appropriate.
Ichimoku Cloud Trading Checklist
- Is price above, below or inside the cloud?
- What is the current broader trend?
- Where is the Tenkan-sen relative to the Kijun-sen?
- Does the Chikou Span support the market interpretation?
- Is the projected cloud strengthening or weakening?
- Are there important support or resistance levels nearby?
- Is the market trending or moving sideways?
- What would invalidate the trade idea?
- How much capital am I willing to risk?
- Is my position size appropriate for that risk?
- Am I entering because of a complete setup or a single indicator signal?
Can Ichimoku Cloud Be Used for Intraday Trading?
Yes, traders can apply Ichimoku to intraday charts, but the indicator should be adapted to the trader's timeframe and strategy.
Shorter timeframes can generate more signals and potentially more noise. Traders should therefore test their approach and understand how the indicator behaves on the specific timeframe and instrument they trade.
Intraday traders should also consider liquidity, volatility, transaction costs and execution quality.
Can Beginners Use the Ichimoku Cloud?
Beginners can learn the indicator, but it is important to understand its components before using it for trading decisions.
Because several lines appear on the same chart, the indicator can initially seem complicated. Learning each component separately and then understanding how they interact can make the system easier to interpret.
Beginners should also practice on historical charts or paper-trading environments before risking real capital.
Frequently Asked Questions About Ichimoku Cloud Strategy
What is the Ichimoku Cloud strategy?
The Ichimoku Cloud strategy uses the components of the Ichimoku Kinko Hyo indicator to analyze trend direction, momentum and potential support and resistance.
What are the five components of Ichimoku?
The five components are Tenkan-sen, Kijun-sen, Senkou Span A, Senkou Span B and Chikou Span.
What does it mean when price is above the Ichimoku Cloud?
Price above the cloud is commonly interpreted as a potentially bullish market environment. However, it should be considered alongside the other Ichimoku components and broader price structure.
What does price below the Ichimoku Cloud mean?
Price below the cloud is commonly interpreted as a potentially bearish environment. It is not a guarantee that prices will continue falling.
Is the Ichimoku Cloud good for beginners?
It can be useful for learning multi-factor technical analysis, but beginners should first understand each component and practice interpreting the indicator before using it for real-money trading.
Can Ichimoku be used for intraday trading?
Yes. Ichimoku can be applied to intraday charts, although shorter timeframes may produce more signals and market noise. The strategy should be tested for the chosen instrument and timeframe.
Is Ichimoku better than moving averages?
Neither is universally better. Ichimoku provides multiple types of information, while moving averages are generally simpler and can be useful for trend analysis. The appropriate tool depends on the trader's strategy and objectives.
Does Ichimoku guarantee profitable trades?
No. Like all technical indicators, Ichimoku can generate false or unsuccessful signals. Risk management remains essential.
Final Takeaway
The Ichimoku Cloud strategy provides traders with a comprehensive way to study trend direction, momentum and potential support and resistance using multiple components on one chart.
The five main components—Tenkan-sen, Kijun-sen, Senkou Span A, Senkou Span B and Chikou Span—should be understood together rather than treated as unrelated signals.
For beginners, the simplest approach is to first determine whether price is above, below or inside the cloud, then evaluate the Tenkan-sen and Kijun-sen relationship, Chikou Span and overall price structure.
Most importantly, an indicator should support a trading plan rather than replace one. No technical-analysis tool can eliminate uncertainty from financial markets, so position sizing, risk limits and disciplined execution remain essential.
Learn Technical Analysis With STOXRA
Explore STOXRA's educational resources to understand technical analysis, chart patterns, indicators, risk management and smarter trading decisions.
Explore STOXRA