What Is Price to Book Value Ratio?
Learn what the Price-to-Book (P/B) ratio means, how to calculate it, interpret high and low values, and use it with other valuation metrics to evaluate stocks.
The price-to-book value ratio compares a company's market price per share with its book value per share. In simple terms, it asks how much investors are paying for each rupee of accounting net assets. A low P/B can look inexpensive, while a high P/B can reflect stronger expected profitability or growth—but neither conclusion is reliable without business and financial context.
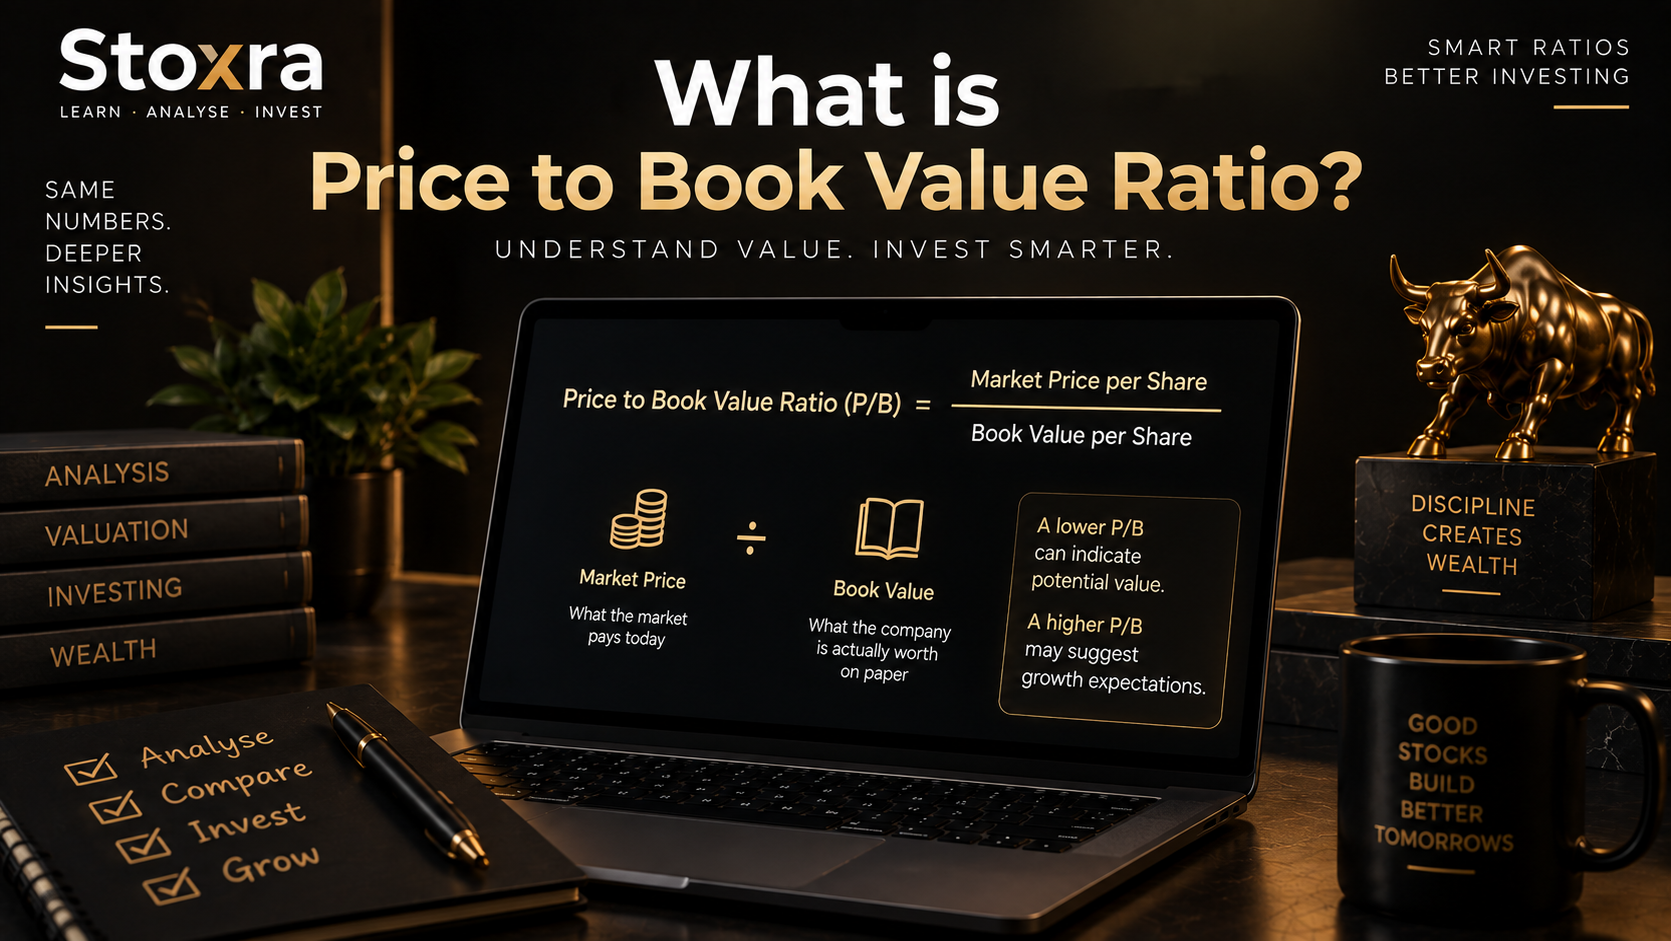
What Is the Price-to-Book Value Ratio?
The price-to-book value ratio, usually shortened to P/B ratio, compares a company's current market price with its book value per share. Book value is broadly the shareholders' equity recorded on the balance sheet, after accounting for liabilities.
That makes P/B especially useful when you want to compare the market's valuation with the accounting value of the assets belonging to shareholders. It is one of several valuation tools investors can use alongside earnings, cash flow, growth, and business quality.
For beginners building their stock market basics , P/B is worth learning because it helps connect a company's balance sheet with its market price.
P/B is a comparison tool, not a buy signal. A lower ratio does not automatically mean a stock is cheap, and a higher ratio does not automatically mean it is expensive.
How to Calculate P/B Ratio
The basic formula is straightforward:
Book value per share can be calculated as:
For example, assume a company has shareholders' equity of ₹1,000 crore and 100 crore outstanding shares. Its book value per share would be ₹10. If the market price is ₹50, the P/B ratio would be 5.
| Input | Example |
|---|---|
| Shareholders' equity | ₹1,000 crore |
| Outstanding shares | 100 crore |
| Book value per share | ₹10 |
| Market price per share | ₹50 |
| P/B ratio | 5.0x |
The calculation only works well when the book value figure is consistent and meaningful. Check the latest balance sheet rather than mixing figures from different reporting periods. Understanding stock screener can also help you shortlist companies for deeper research.
P/B Ratio Calculator
Enter the current share price and book value per share to estimate the price-to-book ratio.
This calculator is a simple estimate based on the values entered. It does not indicate whether a stock is fairly valued.
How to Interpret a High or Low P/B Ratio
A useful way to read P/B is to treat it as a starting question: why is the market willing to pay this amount relative to the company's accounting net assets?
P/B Below 1
The market price is below the stated book value per share. This can look inexpensive, but it may also reflect weak returns, poor asset quality, losses, or business problems.
P/B Around 1
The market price is roughly equal to book value per share. That does not automatically mean fair value because profitability and asset quality still matter.
P/B Above 1
Investors are paying more than the accounting book value. This can reflect stronger profitability, intangible advantages, growth expectations, or a premium business model.
This is why comparing the same ratio across companies can be useful only when the businesses have reasonably comparable economics. A bank, manufacturer, software company, and consumer brand can all have very different relationships between accounting assets and earnings.
Recent Stoxra valuation coverage also shows why a headline multiple should be read alongside growth and execution, including its analysis of Groww valuation analysis and Groww growth and valuation coverage .

When Is P/B Ratio Most Useful?
P/B tends to be more informative for businesses where the balance sheet and tangible assets play an important role in generating returns. Financial institutions are a common example because their assets and liabilities are central to how the business operates.
P/B can also be useful when comparing companies within the same industry. The goal is not to find the lowest number automatically, but to understand why one company trades at a different multiple from its peers.
When two companies have similar P/B ratios, compare their return on equity, asset quality, growth, capital efficiency, and risk. The better business is not necessarily the one with the lower multiple.
For broader context, you can continue learning with Stoxra Learn , or use the AI tools for stock market analysis to organise research around a shortlist of companies.
Stoxra has also covered valuation conditions across the broader market, including Indian equities valuation coverage , market valuation coverage , and Nestle India valuation coverage . These are useful reminders that valuation needs to be interpreted in context rather than in isolation.
Limitations of the Price-to-Book Ratio
P/B is not equally informative for every business. Modern companies can create large amounts of value through software, brands, intellectual property, distribution, data, and other assets that may not appear on the balance sheet in the same way as physical assets.
Book value can also be affected by accounting choices, write-downs, acquisitions, and changes in asset values. Two companies with similar reported book values may therefore have very different economic earning power.
- Accounting value is not the same as economic value.
- Negative or very small book value can make the ratio difficult or meaningless to interpret.
- Different industries require different benchmarks.
- A low P/B can reflect genuine business weakness.
- A high P/B can be justified by high and sustainable returns on equity.
That last point is important. A business that consistently generates strong returns on its equity may deserve to trade well above book value. Conversely, a company trading below book can remain cheap for a reason if its assets produce weak returns.
For another perspective on earnings quality, review Stoxra's earnings quality analysis .

How to Use P/B With Other Valuation Metrics
The strongest use of P/B is usually comparative. Combine it with measures that answer different questions about the business.
| Metric | What it helps you understand |
|---|---|
| P/B Ratio | How market price compares with accounting book value. |
| P/E Ratio | How much investors pay relative to earnings. |
| ROE | How efficiently shareholder capital produces profit. |
| ROCE | How efficiently capital employed generates operating returns. |
| Debt-to-Equity | How dependent the company is on borrowed capital. |
| Free Cash Flow | Whether the business converts operations into cash available after investment needs. |
A company trading at 3x book with a strong and durable ROE can deserve a different assessment from a company trading at 0.7x book while struggling to earn an acceptable return on its capital.
You can also compare valuation with price trends after completing the fundamental work. Stoxra's technical analysis guide can provide additional chart context, while value investing vs trend following offers a broader perspective on different investing approaches.
Stock Screener
Filter companies before comparing valuation metrics such as P/B, then investigate the strongest candidates more deeply.
Explore Stock Screener →Stoxra Learn
Build your understanding of financial ratios, investing concepts, and market fundamentals before relying on a single valuation number.
Continue Learning →AI Market Analysis
Use AI-assisted research to structure questions and compare information while checking important figures against primary sources.
Explore AI Analysis Tools →Paper Trading
Practise building a complete investment thesis and monitoring your decisions before putting real capital at risk.
Explore Paper Trading →Before calling a stock “cheap” because its P/B is low, check ROE, debt, asset quality, earnings, cash flow, industry peers, and the reason the market may be assigning a discount.
Price-to-Book Ratio: Practical Checklist, FAQ, and Final Takeaway
Quick P/B Checklist
- Calculate book value per share using a consistent reporting period.
- Compare the company's P/B with similar businesses.
- Check whether the company's ROE supports the valuation.
- Review debt, asset quality, and cash generation.
- Investigate why the ratio is unusually high or low.
- Use earnings and cash-flow metrics alongside P/B.
- Check whether the business has valuable intangible assets that book value does not capture well.
- Make the final decision only after reviewing valuation and business risk together.
Frequently Asked Questions
There is no universal “good” P/B ratio. What is reasonable depends on the industry, profitability, growth, asset quality, and expected returns on equity.
Is a P/B ratio below 1 always undervalued?No. A ratio below 1 can indicate a possible discount to book value, but it can also reflect weak profitability, poor asset quality, financial stress, or declining business prospects.
What does a P/B ratio of 1 mean?A P/B of 1 means the market price per share is approximately equal to the company's book value per share.
Which industries use P/B most often?P/B is often more useful for asset-heavy or balance-sheet-driven businesses, including many financial institutions. It can be less informative for businesses where intangible assets drive a large share of economic value.
Can book value be negative?Yes. If liabilities exceed assets, shareholders' equity can be negative. In that situation, the standard P/B ratio is generally not meaningful.
The price-to-book value ratio is one of the simplest ways to compare a company's market price with its accounting net assets. It becomes much more useful when you ask why the market is assigning that multiple and then test the answer against profitability, growth, debt, asset quality, and cash flow.
For investors building a valuation framework, the next step is not to memorise a “perfect” P/B number. It is to learn how different metrics work together. Use Stoxra's market basics resources , research tools, and valuation-focused coverage to build that wider view.
For research workflows, the Stoxra AI trading platform can help organise information while you verify the underlying figures yourself AI trading platform .
Looking at market-cap context can also help explain why two companies with different asset bases command very different market values market-cap context .