Decoding the NIFTY Option Chain: How AI Heatmaps Predict Expiry Moves
Stop guessing market direction based on basic candlestick patterns. Discover how to leverage institutional Open Interest (OI) data using Stoxra's real-time AI-Powered Heatmaps to secure a massive edge on Expiry Day.
The Reality of Expiry Day Trading in India
Options trading on the NSE is a zero-sum game. Every time you buy a NIFTY Call option hoping for a breakout, there is an institutional seller (a writer) on the other side of that trade perfectly willing to take the opposite bet. The harsh reality of 2026 is that retail traders rely almost entirely on basic price action—while the "Smart Money" relies on deeply structured data.
If you are trying to trade weekly expirries in NIFTY, BANKNIFTY, or FINNIFTY without understanding the Option Chain, you are effectively flying blind. You might win a few trades through sheer luck, but the institutional algorithms will eventually bleed your account dry.
To survive, you need to track the footprints of the Smart Money. Those footprints are clearly visible in the form of Open Interest (OI). But as we will explore, reading this data manually is no longer enough.
The Anatomy of Open Interest (A Quick Refresher)
Before we dive into AI heatmaps, let's establish the ground rules of Open Interest. OI represents the total number of outstanding derivative contracts that have not been settled. In the Indian market context, we generally view the Option Chain from the perspective of the Option Writers (Sellers), because writing options requires significantly more capital and carries theoretically unlimited risk.
Massive Call OI = Resistance
When you see a huge build-up of Open Interest on the Call side (e.g., at the 23,000 strike), it means deep-pocketed institutions have sold massive quantities of Call options. They will aggressively defend this level to ensure the market does not cross 23,000, making it a strong Resistance zone.
Massive Put OI = Support
Conversely, a massive build-up on the Put side (e.g., at the 22,500 strike) indicates strong Put writing. These institutions are betting the market won't fall below this level. They will defend it fiercely, making 22,500 a rock-solid Support zone.
The Death of the Manual Option Chain
For years, traders would keep a tab open with the NSE India website, staring at the raw Option Chain table. They would manually scan rows of black-and-white text, trying to calculate the Change in OI (Chng in OI) in their heads to figure out where the market was headed.
In 2026, this approach is mathematically suicidal.
The speed of algorithmic trading means that institutional positions shift in milliseconds. A support zone that looked impenetrable at 10:15 AM can vanish completely by 10:17 AM. If you are refreshing a static webpage to read raw numbers, you are reacting to history, not the present.
Manual vs. AI-Powered Analysis
A human takes roughly 45 seconds to analyze the top 10 strikes on a standard Option Chain, mentally calculating the Put-Call Ratio (PCR).
Stoxra’s AI Engine ingests the entire NSE data feed, calculates PCR, tracks shifting OI velocity, and generates a visual heatmap in 12 milliseconds.
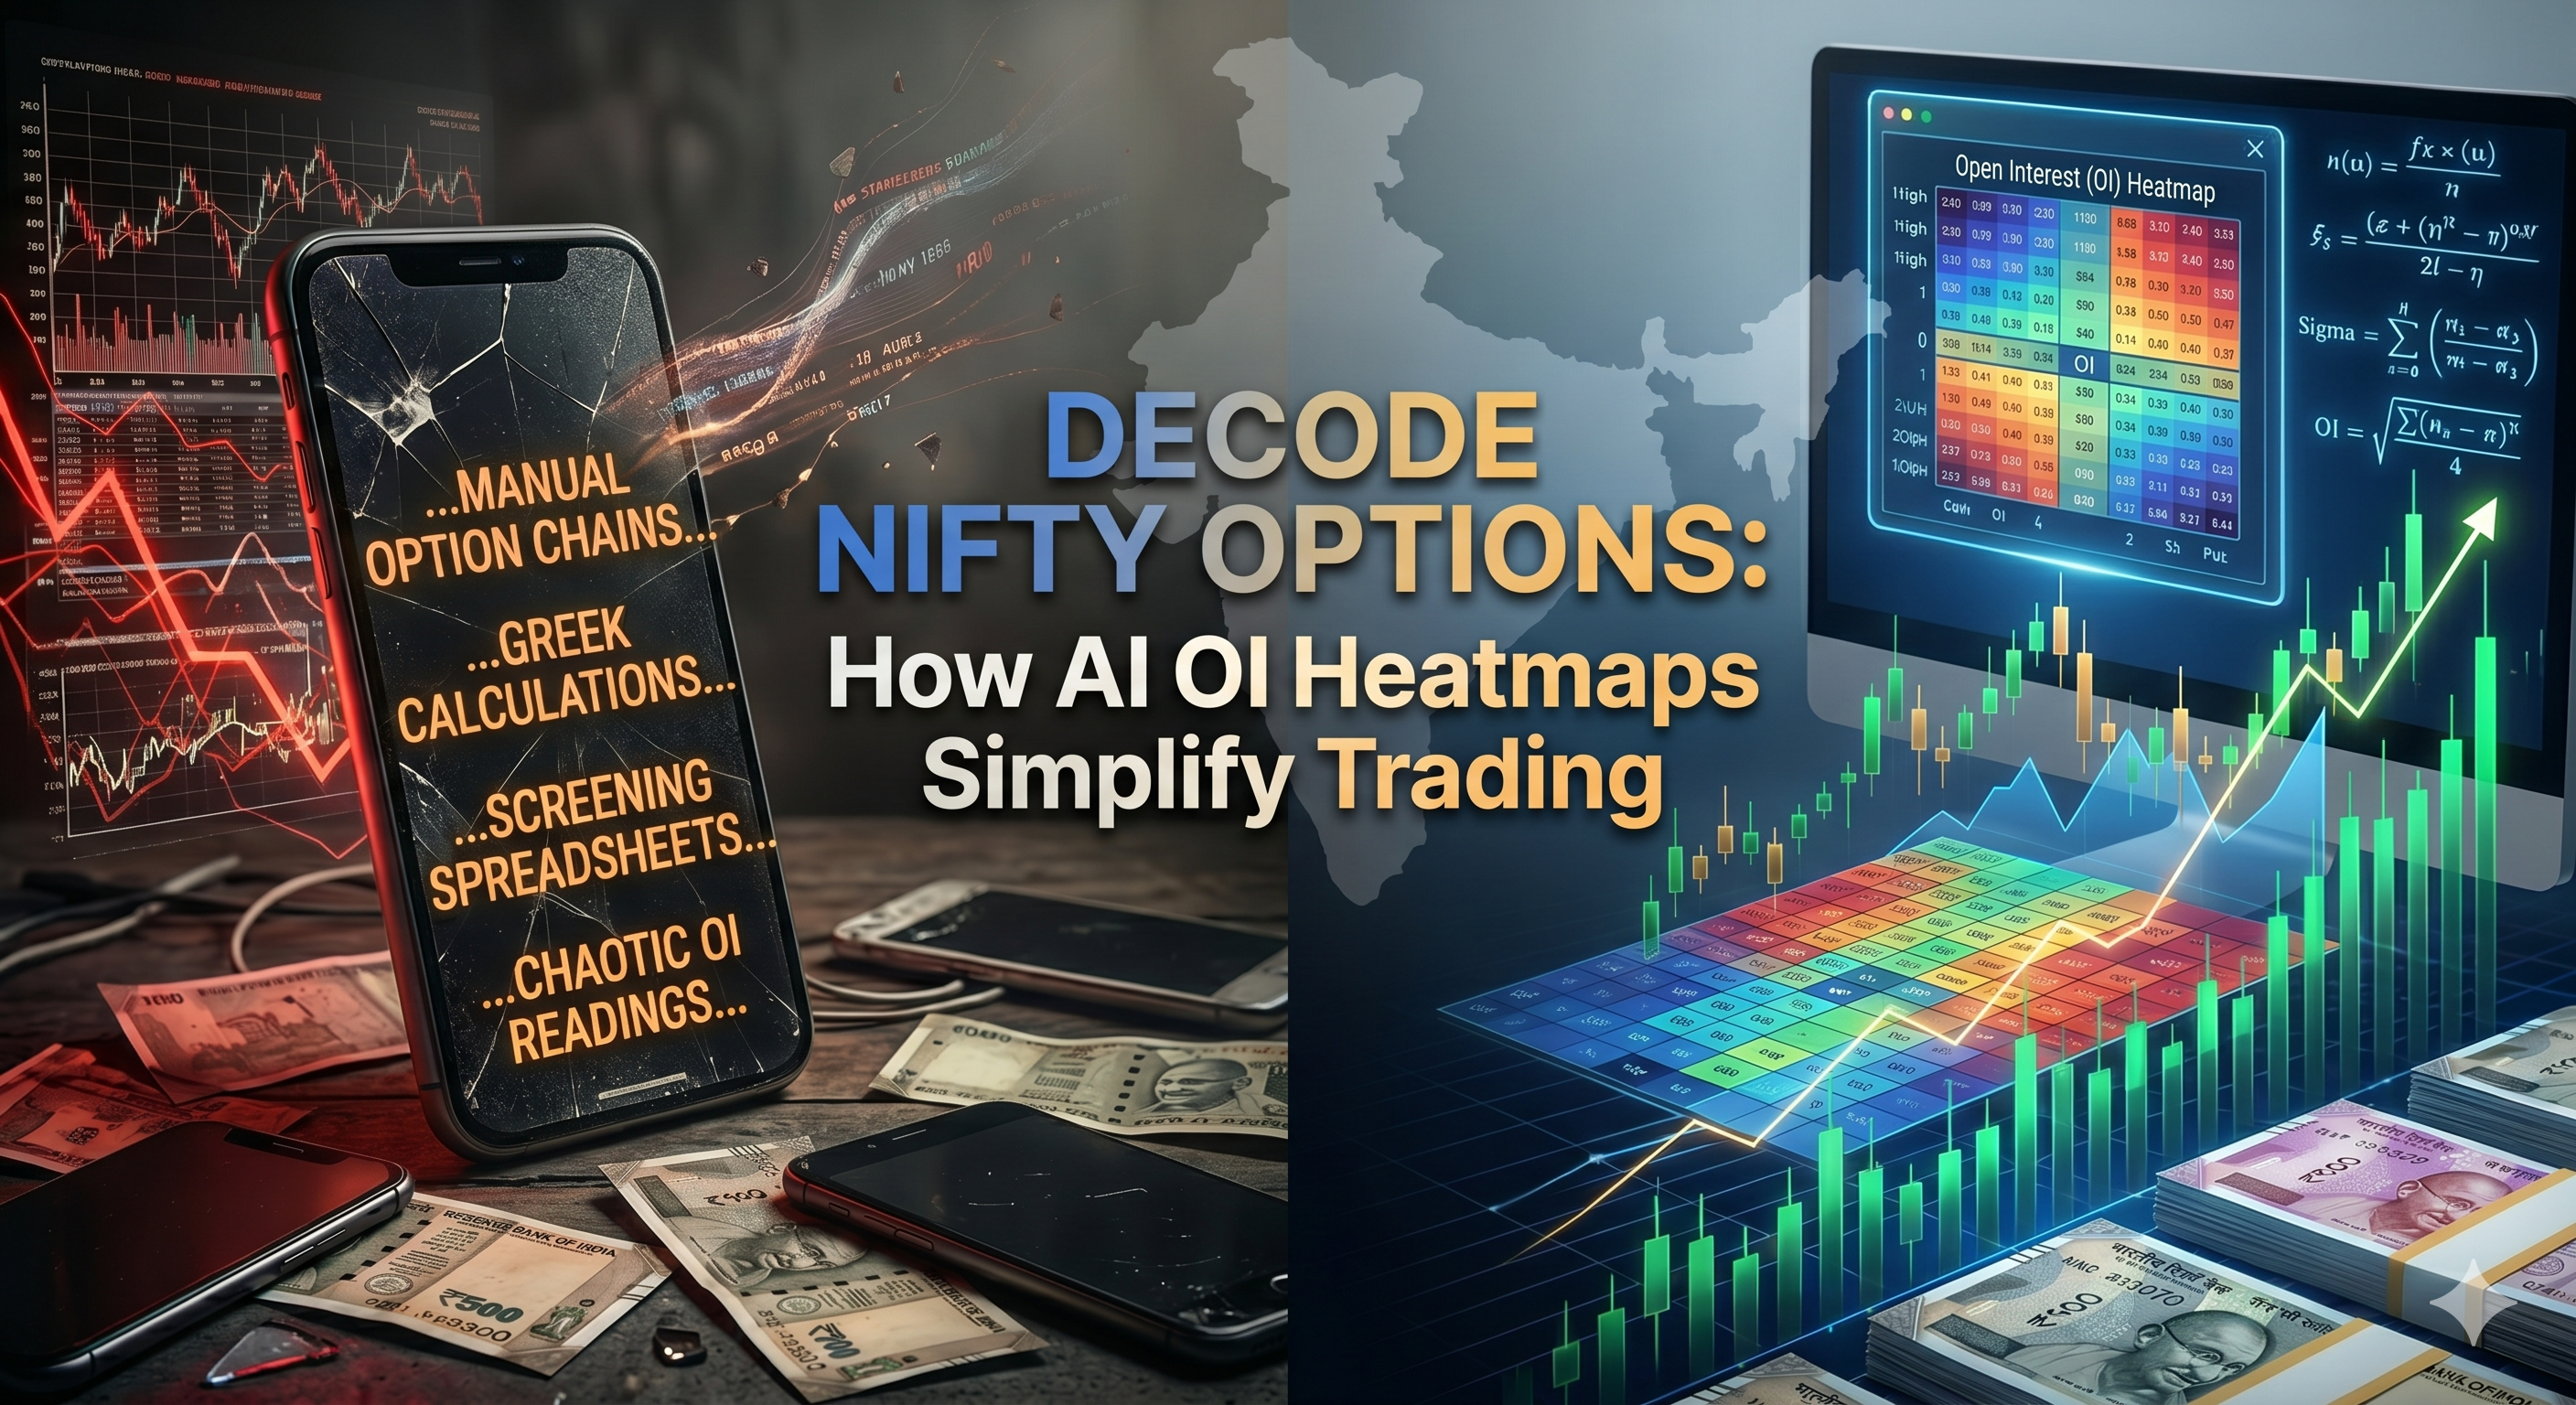
Enter Stoxra: AI-Powered OI Heatmaps
This is where Stoxra's Paper Trading Platform completely changes the game for Indian retail traders. We don't just give you raw data; we visualize it through our proprietary AI OI Heatmaps.
Instead of reading a spreadsheet, Stoxra overlays glowing color-coded bars directly next to your trading chart.
- Red Heat Zones: Instantly visualize where Call writers are building massive walls of resistance. The brighter the red, the heavier the institutional defense.
- Green Heat Zones: Spot the exact strikes where Put writers are establishing the floor.
- Velocity Alerts: The AI doesn't just show static volume. If Call writers suddenly start unwinding (short covering) at a rapid pace, Stoxra’s AI flashes an alert, signaling an impending upward breakout.
By integrating this directly into your paper trading environment, Stoxra allows you to execute simulated trades based on institutional data, risk-free. You learn to trade with the Smart Money, not against it.
Unlock Max Pain & Advanced Greeks
While standard heatmaps give you a massive visual advantage, serious options traders need absolute precision.
Stoxra Pro unlocks real-time Max Pain Theory calculations. The AI instantly pinpoints the exact strike price where Option Buyers will experience the maximum financial loss upon expiry. Because option sellers manipulate the market to close near this price, knowing the live Max Pain value gives you an unprecedented predictive edge.
Combine this with real-time IV (Implied Volatility) crush alerts, and you are no longer trading—you are sniping.
Upgrade to Stoxra Pro Today →The Actionable Strategy: Paper Trading an Expiry Day
Knowing the theory is useless without execution. Here is exactly how you can use Stoxra’s free platform to master NIFTY Expiry Day (Thursday) without risking a dime of your real capital:
- Wait for the Morning Settle: Let the market open. Do not place a trade before 10:00 AM. Let the institutions establish their initial OI walls.
- Check the Stoxra Heatmap: Open your Stoxra dashboard. Identify the highest Red Bar (Call Resistance) and the highest Green Bar (Put Support). This is your trading range for the day.
- Look for Divergence: Watch price action approach the Resistance line. If the price is rising, but the Red Bar (Call OI) is *increasing*, the breakout is likely a trap.
- Execute on Paper: When you spot the rejection at the OI resistance wall, initiate a virtual short position in the Stoxra Paper Trading terminal. Set a strict stop-loss.
- Let the AI Audit You: After you close the trade, review the AI Mentor's Execution Grade. Did you enter too early? Did you respect the OI data? The AI will tell you exactly where you succeeded or failed.
See the Market Through Institutional Eyes.
You cannot fight institutional algorithms with basic charts and gut feelings. You need the right data, visualized perfectly, and a risk-free environment to practice it.
- Real-time NSE Data Integration
- AI-Powered Option Chain Heatmaps
- Post-Trade Execution Grading
- Zero Financial Risk