How Machine Learning Is Used in Stock Prediction
Learn how machine learning is used in stock prediction, from historical market data and feature engineering to model training, testing, prediction and risk management.
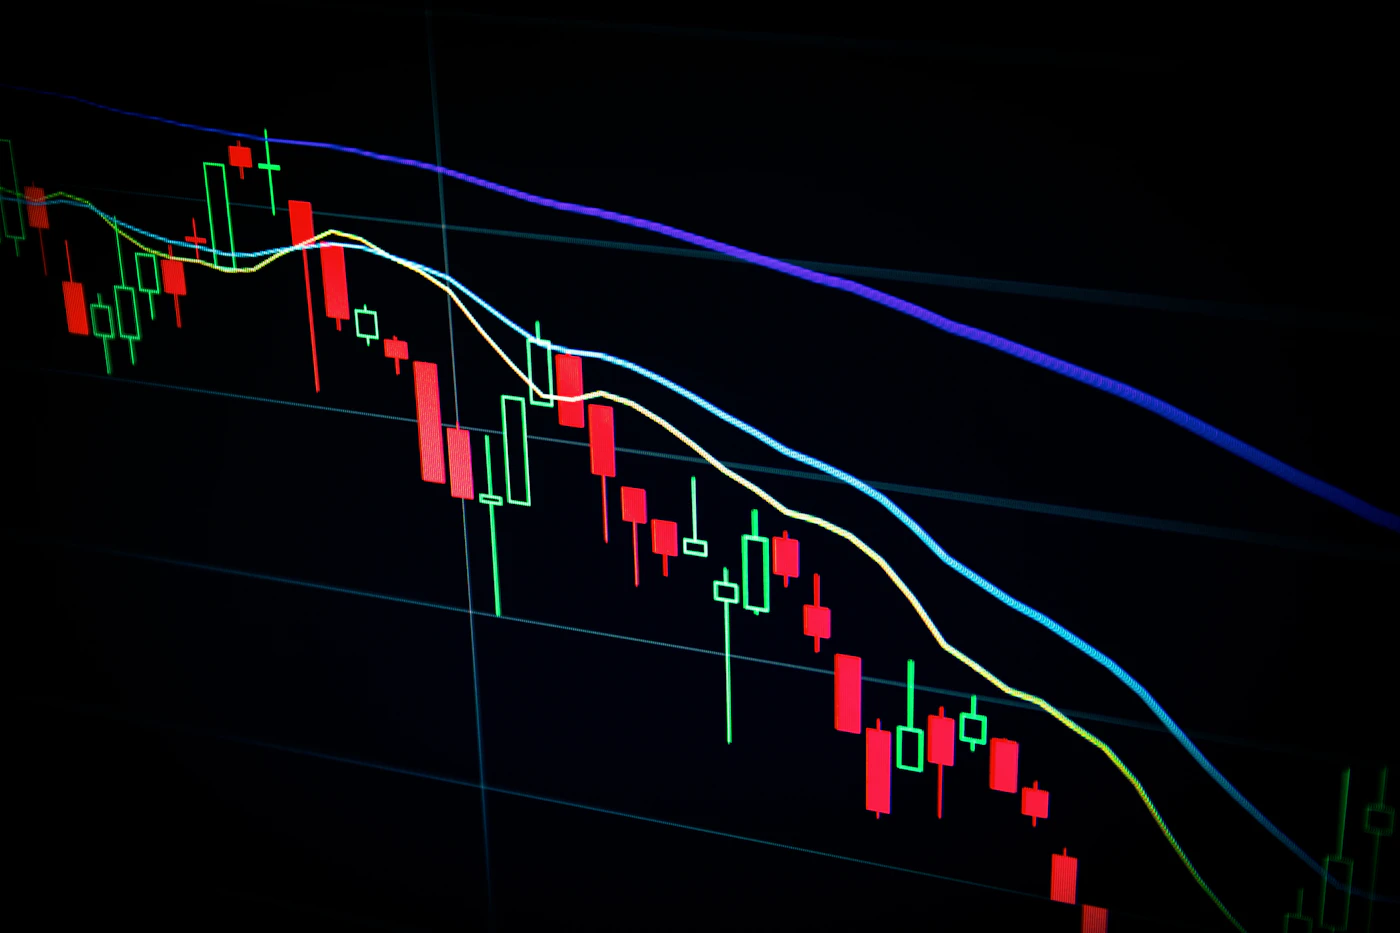
Stock markets generate enormous amounts of information every day. Prices change continuously, trading volume fluctuates, volatility moves between different levels and technical indicators create additional data points. For a human trader, analysing all of this information consistently can be difficult.
Machine learning can help by processing large datasets and searching for relationships that may be difficult to identify manually. In trading, these models can be used for tasks such as pattern recognition, market classification, forecasting, signal generation and strategy research.
However, machine learning does not provide a guaranteed way to predict future stock prices. Financial markets are affected by unexpected events, changing investor behaviour, economic conditions and many other factors.
Machine learning can analyse historical market data and identify patterns that may help generate stock-market predictions or trading signals. Its usefulness depends heavily on data quality, model design, testing and risk management. A machine-learning prediction should be treated as research information, not a guaranteed forecast.
What Is Machine Learning in Stock Trading?
Machine learning is a branch of artificial intelligence in which computer models learn relationships from data instead of relying entirely on manually written instructions.
In stock trading, a machine-learning model can be trained using historical market information. The model may examine variables such as price, volume, volatility, technical indicators and other relevant data.
After learning from historical examples, the model can be tested on data it has not previously seen. If the results are useful, the model may become part of a broader trading research or decision-support system.
This is different from a simple rule-based algorithm. A traditional algorithm might say:
A machine-learning model can instead learn relationships between multiple variables from historical examples. The resulting model can be more flexible, but it can also be more difficult to understand and validate.
Before learning advanced AI methods, it is useful to understand what algorithmic trading means in simple terms .
Why Is Machine Learning Used for Stock Prediction?
The main attraction of machine learning is its ability to process large amounts of information and identify relationships within data.
1. Large Amounts of Data
Markets produce huge datasets containing historical prices, volume, volatility and other variables. Machine-learning systems can process this information much faster than manual analysis.
2. Pattern Recognition
Some relationships between market variables may not be obvious when looking at a chart. Machine-learning models can search for recurring relationships across historical observations.
3. Multiple Variables
A model can potentially consider several variables at the same time. For example, price momentum, volume and volatility can be analysed together instead of independently.
4. Automated Analysis
Once a model has been developed and validated, software can repeatedly process new market data without requiring a trader to manually perform every calculation.
5. Consistent Process
A properly designed system follows its defined process consistently. This can reduce some forms of emotional decision-making, although it does not eliminate model risk.
Stoxra's guide on how AI is changing algorithmic trading strategies explains how AI can support data processing, pattern detection, strategy testing and risk analysis.
How Machine Learning Is Used in Stock Prediction
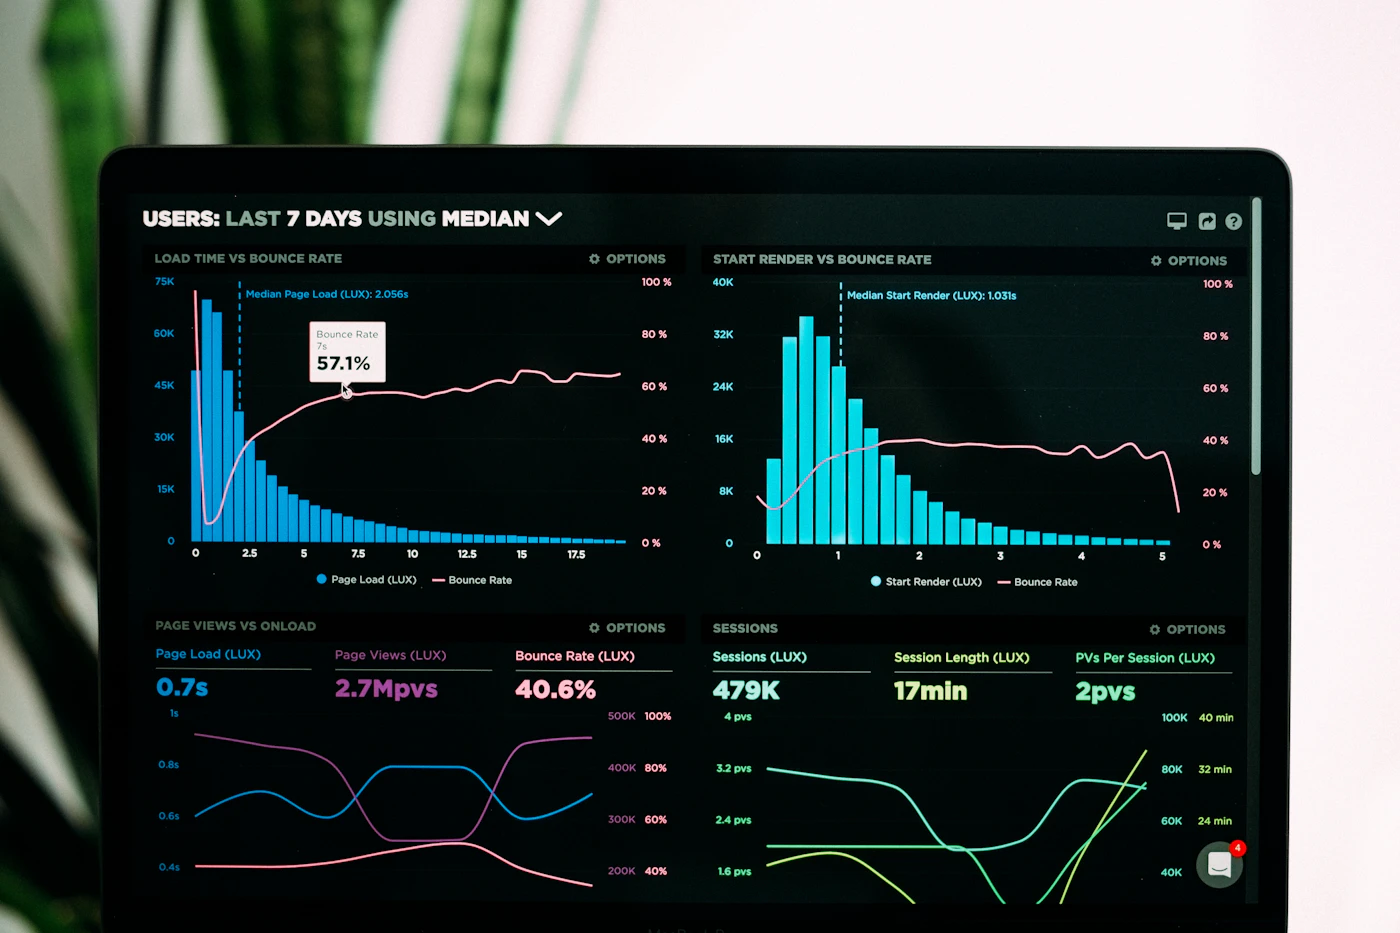
Machine-learning stock prediction generally follows a sequence of steps. The exact process depends on the model and the purpose of the system, but the basic workflow is similar.
Step 1: Collect Historical Market Data
The first step is collecting historical information relevant to the prediction problem. Depending on the strategy, this may include open, high, low and closing prices, trading volume and volatility.
Some advanced systems may use additional datasets, but adding more information does not automatically make a prediction model better.
Step 2: Clean and Prepare the Data
Raw market data needs to be checked and prepared before it is used for machine learning. Missing values, duplicate records or incorrect data can affect the model.
Data preparation is often one of the most important parts of a machine-learning workflow because the model can only learn from the information it receives.
Step 3: Create Useful Features
Features are measurable variables that a machine-learning model can use as inputs.
Examples can include price returns, moving-average relationships, trading volume changes, volatility measurements and momentum indicators.
Technical-analysis knowledge can therefore be useful when building machine-learning systems. Learn more through technical analysis in stock trading .
Step 4: Train the Machine-Learning Model
During training, the model receives historical examples and attempts to learn relationships between the input features and the target outcome.
The target might be a future price movement, a direction classification, a probability estimate or another measurable market outcome.
Step 5: Test the Model
Testing is essential because a model can perform well on the data used during development without working well on new information.
A separate testing period helps determine whether the model can produce useful results on data that it did not use during training.
Step 6: Generate Predictions or Signals
After validation, the model can process new market data and produce predictions, classifications or trading signals according to its design.
Step 7: Monitor Performance
Markets change over time. A model that performed well during one market environment may behave differently later. Continuous monitoring is therefore important.
This workflow connects closely with backtesting an AI trading strategy , where historical data is used to evaluate how a strategy would have behaved.
What Types of Machine Learning Can Be Used?
Different machine-learning approaches can be used for different prediction and classification problems. The choice depends on the data, objective and complexity of the problem.
Supervised Learning
The model learns from labelled historical examples. It can be used for classification or numerical prediction tasks.
Unsupervised Learning
The model searches for structures or groups within data without relying on predefined labels. It can be useful for market classification and pattern research.
Time-Series Models
These approaches are designed to work with observations where time and sequence are important.
Deep Learning
Neural-network-based approaches can process complex relationships, although they may require substantial data, computing resources and careful validation.
What Data Can Machine Learning Analyse?
The data used by a stock-prediction model depends on the specific objective. Common inputs include:
- Historical price data
- Trading volume
- Price returns
- Volatility measurements
- Moving averages
- Momentum indicators
- Market breadth information
- Other structured market variables
A model can also be designed to analyse combinations of variables rather than relying on a single indicator.
For example, an AI system could study whether a particular combination of momentum, volume and volatility has historically appeared before a specific type of price movement.
Stoxra's AI tools for stock market analysis resource provides additional context on how AI can assist market research.
How AI Finds Patterns Humans May Miss
Human traders are capable of recognising visual patterns quickly, but they cannot manually compare every historical observation across thousands of securities and multiple timeframes.
Machine learning can examine relationships across a much larger dataset. Instead of simply looking for one visible chart formation, a model can evaluate several numerical characteristics at the same time.
Imagine a stock that is approaching a previous resistance level. At the same time, volume is increasing, short-term momentum is improving and volatility is changing.
A machine-learning system can be trained to investigate whether combinations like these occurred before similar market movements in historical data.
That does not mean the same outcome must happen again. It simply gives researchers another way to evaluate market behaviour.
Read more about automated chart analysis in how AI detects patterns humans miss in charts .
Machine Learning Stock Prediction vs Traditional Analysis
| Factor | Traditional Analysis | Machine Learning |
|---|---|---|
| Rules | Usually defined manually | Can learn relationships from data |
| Data Volume | Limited by manual analysis | Can process large datasets |
| Pattern Detection | Depends heavily on trader experience | Can search historical relationships |
| Interpretability | Often easier to explain | Can be difficult depending on the model |
| Adaptability | Rules require manual changes | Some models can be retrained |
| Risk | Human and strategy risks | Includes model, data and overfitting risks |
Backtesting Machine-Learning Predictions
Before considering a machine-learning strategy for live use, researchers generally need to test how it would have behaved on historical data.
Backtesting can help answer questions such as:
- How many signals did the model generate?
- How often were the signals profitable?
- How large were historical drawdowns?
- How did the model behave during different market conditions?
- What happened after including realistic trading costs?
However, a backtest should not be treated as proof of future profitability. Historical results can be affected by data quality, assumptions, overfitting and execution differences.
Stoxra's AI and algorithmic trading guide also highlights why testing and validation remain important when using AI in trading.
A strong historical backtest does not guarantee strong live performance. Always separate training and testing data and evaluate whether the model continues to work on unseen information.
What Is Overfitting in Machine-Learning Stock Prediction?
Overfitting is one of the biggest challenges in machine-learning-based trading.
A model is overfit when it becomes too closely adapted to the historical data used during development. It may appear highly accurate on that data but perform poorly on new observations.
For example, imagine repeatedly changing a model until it produces an extremely attractive historical result. The model may have learned historical noise instead of a relationship that is likely to remain useful.
How Traders Can Reduce Overfitting Risk
- Separate training and testing data.
- Use out-of-sample validation.
- Avoid excessive parameter optimisation.
- Test across different market conditions.
- Include realistic transaction costs.
- Monitor performance after deployment.
- Prefer simpler models when appropriate.
This is why machine learning should be combined with disciplined strategy development rather than treated as a shortcut to guaranteed returns.
Does Machine Learning Really Predict Stock Prices?
Machine learning can generate predictions, but the word "prediction" should be interpreted carefully in financial markets.
A model may estimate the probability of a particular market outcome or classify whether historical conditions resemble a particular setup. It cannot know every future event.
Unexpected company announcements, economic developments, geopolitical events, liquidity changes and sudden market sentiment shifts can affect prices in ways that historical data cannot fully capture.
Therefore, machine learning is better viewed as a tool for analysing probabilities and patterns rather than a system that knows the future.
Benefits of Machine Learning in Stock Analysis
Speed
Machine-learning systems can process large amounts of structured market information quickly.
Scale
Software can analyse many securities or historical observations more efficiently than manual analysis.
Pattern Discovery
Models can search for relationships between multiple variables that may not be obvious visually.
Consistency
Once a process is defined, software can apply the same analytical workflow repeatedly.
Limitations and Risks of Machine Learning in Trading
Machine learning has significant potential, but it also introduces additional risks.
- Historical patterns may disappear.
- Poor data can produce poor predictions.
- Models can overfit historical information.
- Unexpected market events can break historical relationships.
- Complex models may be difficult to interpret.
- Transaction costs can reduce theoretical performance.
- Model performance can change as market conditions evolve.
Risk management therefore remains essential. Explore how algorithmic trading can support risk management for more information.

How Beginners Can Learn Machine-Learning Trading
Beginners should not start by building the most complicated possible model. A better approach is to understand the foundations first.
- Learn stock-market basics.
- Understand technical analysis.
- Learn basic statistics and probability.
- Understand how machine learning works.
- Learn how historical market data is structured.
- Build a simple strategy before adding machine learning.
- Backtest the strategy carefully.
- Validate the model using unseen data.
- Practise with paper trading before considering real capital.
Start with Stoxra's stock-market basics for beginners before moving into advanced AI-based analysis.
You can also explore paper trading vs real trading to understand how virtual practice can fit into a learning process.
Machine Learning and Algorithmic Trading
Machine learning and algorithmic trading are closely related, but they are not exactly the same thing.
An algorithm can operate using fixed rules without using machine learning. For example, a system may buy when one moving average crosses another and exit when a predefined stop-loss is reached.
Machine learning adds a data-driven layer that can help analyse relationships, classify market conditions or generate predictions.
This means a modern trading system can combine traditional algorithmic rules with machine-learning components.
Learn more through common algorithmic trading strategies and top algorithmic trading strategies .
20+ Stoxra Resources for AI, Machine Learning and Trading
Continue learning with these related Stoxra resources:
Frequently Asked Questions
Machine learning can analyse historical market data, identify relationships between variables and generate predictions or classifications based on patterns learned from historical examples.
Machine learning can generate predictions, but it cannot guarantee accurate future stock prices. Market conditions change and unexpected events can affect price movements.
Depending on the model, inputs can include historical prices, trading volume, returns, volatility and technical indicators. The relevant data depends on the prediction objective.
Overfitting occurs when a model becomes too closely adapted to historical training data and performs poorly when exposed to new or unseen data.
They serve different purposes. Traditional analysis uses defined methods and indicators, while machine learning can discover relationships from data. They can also be combined in a broader research process.
Beginners should first understand market fundamentals, technical analysis, risk management and strategy testing. Paper trading and careful validation can be useful before considering real capital.
Final Thoughts
Machine learning can change how traders study financial markets by allowing large amounts of historical data to be analysed systematically. Models can identify relationships between price, volume, volatility and other variables that may be difficult to evaluate manually.
However, machine learning is not a crystal ball. A model can produce impressive historical results and still fail when market conditions change. Data quality, overfitting, model assumptions and execution costs can all affect real-world performance.
The strongest approach is therefore to use machine learning as part of a disciplined research process. Define the problem, prepare quality data, train carefully, test on unseen information, evaluate risk and continue monitoring the model.
Explore AI-Powered Trading With Stoxra
Learn how AI, algorithmic trading and structured market analysis can support a more systematic trading-learning journey with Stoxra.
Explore Stoxra AI