Can Automatic Candlestick Pattern Detection Improve Your Trading
Can automatic candlestick pattern detection improve your trading? Explore how automated pattern recognition can speed up technical analysis, reduce repetitive chart scanning, and help traders identify potential setups while keeping human validation and risk management at the center.
What Is Automatic Candlestick Pattern Detection?
Automatic candlestick pattern detection is the process of using software or algorithmic systems to scan price charts and identify recognised candlestick formations. Instead of visually checking every candle, a system can evaluate the relationship between open, high, low, and close prices and flag patterns that match defined rules.
This can be useful when a trader follows multiple stocks, indices, or timeframes. A manual chart review can become repetitive, while an automated detector can provide a structured way to identify potential setups for further analysis.
Why Traders Look for Candlestick Patterns
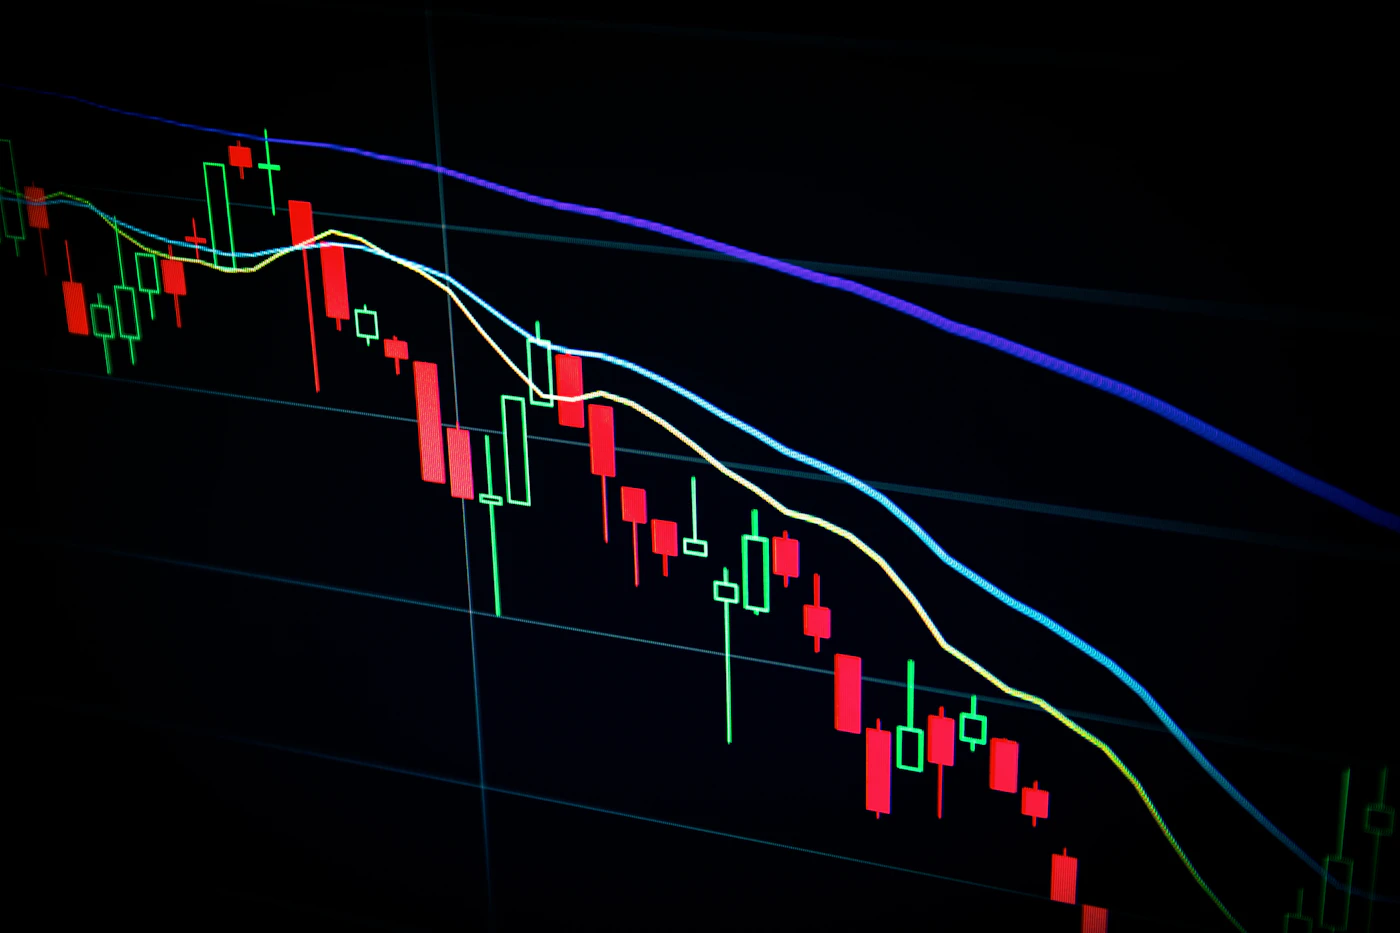
Candlestick patterns are popular because they present price movement in a compact visual format. Individual candles and combinations of candles can help traders study momentum, rejection, indecision, and potential changes in market behaviour.
Common examples include bullish and bearish engulfing patterns, hammer and shooting star formations, doji candles, morning stars, evening stars, and other multi-candle structures. Each pattern is interpreted in the context of the surrounding price action rather than in isolation.
For readers who are still building their foundation, this candlestick patterns guide for beginner traders explains the basic formations and how they are generally interpreted.
How Automatic Detection Works
At a basic level, an automated detector converts candlestick-pattern definitions into rules that software can evaluate against market data. The system then scans historical or live chart data and marks candles or candle sequences that satisfy those rules.
Collect price data
Open, high, low and close values are collected for the selected instrument and timeframe.
Evaluate candle relationships
The system compares candle bodies, wicks, ranges and relationships between consecutive candles.
Match pattern rules
When the defined conditions are satisfied, the detector labels the corresponding pattern.
Present the result
The detected pattern can be displayed on a chart or surfaced as part of a broader analysis workflow.
Can Automatic Detection Actually Improve Trading?
It can improve parts of the trading process, especially chart scanning and consistency. Whether it improves trading results, however, depends on how the detected patterns are used.
Manual Detection
- Requires repeated visual chart scanning
- Can take longer across many instruments
- Interpretation may vary from one review to another
- Easy to overlook setups when monitoring many charts
- Useful for learning pattern structure directly
Automatic Detection
- Can scan large numbers of candles quickly
- Applies predefined rules consistently
- Can reduce repetitive chart-review work
- Can help surface potential setups for investigation
- Still requires human validation and risk management
The biggest advantage is therefore not that automation predicts the market perfectly. Its value is that it can help traders move from manually searching for every possible pattern toward a more structured process of scan → validate → plan → execute → review.
Where Automatic Candlestick Detection Can Go Wrong
A detector can identify a pattern correctly according to its rules and still produce a weak trading opportunity. Candlestick formations do not exist independently of market context.
1. A pattern does not guarantee direction
A bullish-looking formation does not guarantee a price increase. Markets can invalidate patterns quickly, particularly during volatile conditions.
2. Context matters
The same candlestick formation may have a different interpretation depending on the prevailing trend, support and resistance levels, volume, volatility, and timeframe.
3. Rule definitions can differ
Different platforms may use slightly different thresholds when defining a pattern. This means two detection systems can potentially label the same chart differently.
4. Too many signals can create noise
If every detected formation is treated as a trade opportunity, the trader may end up taking too many low-quality setups. Filtering is therefore an important part of any automated workflow.
How to Use Automatic Pattern Detection More Effectively
The most useful approach is to combine automated detection with a repeatable validation process. Instead of entering a trade immediately after a pattern appears, use the detected formation as the beginning of your analysis.
Scan
Use automatic detection to identify potentially relevant patterns across your selected watchlist.
Check market context
Review trend, support and resistance, volatility, timeframe and other indicators relevant to your strategy.
Define the trade plan
Before entering, establish the entry condition, invalidation level, target and position size.
Review the result
Track whether the pattern and surrounding conditions actually supported your strategy over time.
This review process is particularly useful when combined with paper-trading. If you are testing your approach, read our guide on how to improve paper trading results to build a more disciplined testing process.

Where AI Can Add More Value
Traditional rule-based detection can identify predefined formations, but modern trading platforms can go further by bringing several analysis components together. Depending on the platform, this can include chart analysis, screening, market data, technical indicators, alerts, backtesting, and other research tools.
A Practical AI-Assisted Workflow
This is where an AI-enabled trading platform can become more useful than a standalone pattern detector: the detected pattern becomes one input within a larger decision-support workflow.
See Stoxra's AI Trading Platform →Who Can Benefit From Automatic Candlestick Pattern Detection?
Active Chart Analysts
Useful for traders who regularly monitor multiple instruments and timeframes.
Pattern-Based Traders
Can reduce the repetitive work involved in searching for recognised formations.
Strategy Testers
Can help create a consistent way to identify candidate setups for further testing.
Developing Traders
Can help learners compare automated detections with their own chart observations.
Is Automatic Candlestick Pattern Detection Worth Using?
Yes, when it is used as part of a broader trading process. Automatic candlestick pattern detection can make chart scanning faster, reduce repetitive work, and bring greater consistency to the first stage of technical analysis.
But the detection itself is not a complete strategy. Traders still need to consider market context, confirmation, risk, position sizing, execution and ongoing performance review.
Ready to Explore Smarter Trading Tools?
Move beyond manually scanning every chart. Explore how AI-powered trading tools can support technical analysis, research and a more structured trading workflow.
Sign Up & Explore Stoxra →Built for traders who want a more efficient way to analyse markets.