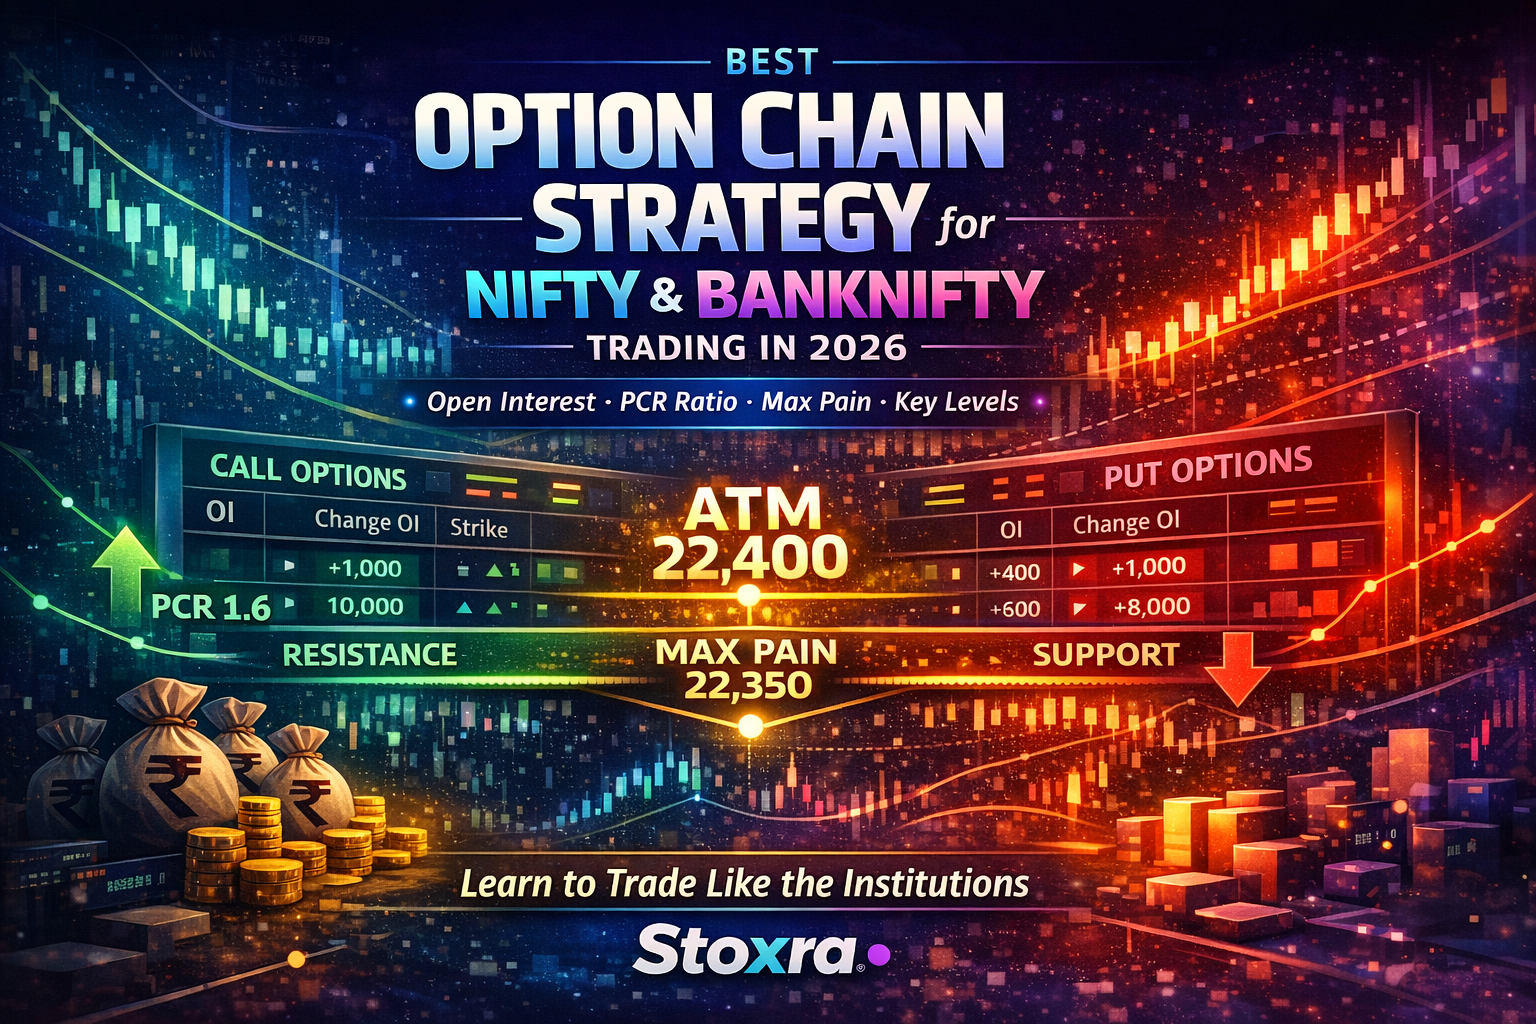
Best Option Chain Strategy for NIFTY & BANKNIFTY in 2026
Retail traders see the option chain as a data table. Institutional traders see it as a battlefield. Every spike in open interest, every shift in IV skew, every sudden unwinding at a key strike is a signal — and most beginners miss all of them. This guide teaches you five advanced-yet-accessible option chain strategies that Indian traders are using in 2026 for NIFTY and BANKNIFTY, complete with real-session logic, NIFTY-vs-BANKNIFTY differences, and step-by-step execution on Stoxra's built-in option chain with AI-powered analysis that no other retail platform in India offers.
Table of Contents
Section NavigationSee it in action: open a free Stoxra account and explore the live NIFTY and BANKNIFTY option chain with visual OI bars, change-in-OI tracking, and AI mentor analysis right now.
Quick Answer
The five best option chain strategies for NIFTY and BANKNIFTY in 2026 are: Institutional OI Trap Detection (spot and avoid false OI walls), IV Skew Edge (use volatility imbalance as a directional signal), OI Buildup Continuation (ride fresh institutional positioning), Expiry-Day Pin (trade the max-pain gravity near settlement), and Dual-Index Divergence (exploit NIFTY and BANKNIFTY OI disagreements). Stoxra's built-in option chain shows every data point these strategies require — free on all accounts. Stoxra Premium adds the AI-powered layer: OI heatmaps, IV skew alerts, max pain overlay, and real-time notifications when institutional positioning shifts.
What Institutional Traders See in the Option Chain That Retail Traders Miss
When a retail trader looks at the option chain, they see numbers — OI, volume, premium. When an institutional trader looks at the same data, they see positioning, intent, and traps. The difference is not the data. It is the interpretation. Understanding how institutions use the option chain gives you the mental framework to stop being the liquidity provider and start being the informed participant.
Institutions do three things in the option chain that most retail traders never notice. First, they build OI walls at strikes they expect to defend. These become the support and resistance zones that Stoxra highlights automatically. Second, they shift OI intraday to adjust their positioning as the session unfolds. Stoxra's change-in-OI tracking makes these shifts visible in real-time. Third — and this is what most guides never teach — they sometimes create false OI concentration to lure retail traders into breakout or reversal trades that immediately fail.
This third behaviour — the OI trap — is one of the most profitable patterns to recognise, and it is the first strategy in this guide. Stoxra Premium's OI heatmaps make trap patterns visible because they show OI building and unwinding across multiple sessions, not just the current snapshot. When you see massive OI appear at a strike in the last 30 minutes of the previous session and then start unwinding immediately at market open, that is often a trap — and Stoxra's AI flags it.
OI walls = positioning
Large OI at a strike means capital is committed there. Institutions defend these levels — until they choose not to. Stoxra highlights these walls visually on every account.
OI shifts = live adjustment
Change-in-OI during the session reveals whether institutions are adding, holding, or exiting. Stoxra tracks this in real-time with colour-coded indicators.
OI traps = manufactured levels
Sometimes large OI appears to lure retail into false confidence at a level that was never intended to hold. Premium OI heatmaps expose these patterns across sessions.
Stoxra advantage: most platforms show you the option chain. Stoxra helps you read it like an institution — with visual OI zones, real-time shifts, and Premium AI that flags when something does not look right. Start free →
5 Best Option Chain Strategies for NIFTY & BANKNIFTY Trading in 2026
01
Institutional OI Trap Detection
Logic: when a massive OI position appears at a strike in the final hour of the previous session or pre-market, and then begins unwinding within the first 30 minutes of the next session, it is likely a trap. The OI was placed to create the appearance of a strong level. Once retail traders position themselves based on it, institutions unwind and price moves through the level.
How to trade it: do NOT trade in the direction the OI suggests. Instead, wait for the unwinding confirmation (negative change-in-OI at that strike with price approaching) and enter in the breakout direction. This is a contrarian OI strategy — you are trading against the manufactured level, not with it.
Stoxra execution: Premium OI heatmaps show multi-session OI changes, making it easy to spot overnight OI spikes that unwind at open. The AI mentor flags "unusual OI build followed by rapid unwind" as a potential trap pattern. Paper trade these setups on Stoxra to build pattern recognition before risking capital. Try it free →
02
IV Skew Edge Strategy
Logic: implied volatility is not uniform across the option chain. OTM puts typically have higher IV than equidistant OTM calls — this is the "volatility skew." When the skew widens dramatically (put IV rises much faster than call IV), it signals institutional fear of downside. When the skew narrows or inverts (call IV rises above put IV), it signals unusual upside demand.
How to trade it: use the skew as a directional filter. Wide put skew = the market is pricing in fear, which often means a bounce is approaching (contrarian). Narrowing or inverting skew = unusual call demand, which confirms bullish momentum. Combine with OI data for entry timing.
Stoxra execution: Stoxra displays IV for every strike on both NIFTY and BANKNIFTY. Premium highlights IV anomalies and skew shifts with visual alerts so you do not need to compare numbers manually. This is one of the most underused data points in Indian retail trading — and Stoxra makes it accessible. See IV skew on Premium →
03
OI Buildup Continuation Strategy
Logic: when fresh OI is building at a strike AND price is moving in the direction that benefits that positioning, it signals institutional conviction. For example: put OI building at 24,000 while NIFTY is at 24,200 and rising means put sellers are confident the index will stay above 24,000. That is a bullish continuation signal. Enter long on a pullback toward the building OI strike.
How to trade it: identify strikes where change-in-OI is positive and increasing. Confirm that price is moving favourably for those position holders. Enter on a pullback toward the OI strike with a stop below the level. Target is the next significant OI level in the direction of the move.
Stoxra execution: Stoxra's change-in-OI indicators show exactly where fresh positions are accumulating. The free account gives you the core data. Premium adds the OI heatmap that shows accumulation intensity across the full strike range — making it obvious where institutional conviction is strongest. Start free →
04
Expiry-Day Pin Strategy
Logic: on expiry day, NIFTY and BANKNIFTY tend to gravitate toward the strike where the maximum number of options expire worthless — the max pain level. This is not a guaranteed prediction, but it is a statistical tendency driven by institutional incentive to minimise payout. When price is significantly above or below max pain in the morning of expiry day, a move back toward max pain has elevated probability.
How to trade it: on Thursday morning (weekly expiry), check the max pain level. If NIFTY is 150+ points away from max pain, consider a directional trade back toward it. Use tight stops because expiry-day volatility can be sharp. This strategy has the highest win rate in the final 2–3 hours of expiry.
Stoxra execution: Stoxra Premium calculates max pain for both NIFTY and BANKNIFTY automatically and displays it on the option chain view. You see the number instantly. Combine it with the OI range to identify the most probable settlement zone. Paper trade every Thursday on Stoxra to build a dataset showing how often the pin-to-max-pain pattern holds. Unlock max pain →
05
Dual-Index Divergence Strategy
Logic: NIFTY and BANKNIFTY usually move in the same direction, but their option chains sometimes disagree. If NIFTY OI data is bullish (high put OI building, PCR rising) but BANKNIFTY OI data is bearish (high call OI building, PCR falling), a divergence exists. These divergences often resolve within 1–2 sessions, and the resolution direction is usually with the broader market (NIFTY).
How to trade it: when the two indices' OI structures disagree, trade the lagging index in the direction of the leading index's OI signal. For example: if NIFTY OI is bullish and BANKNIFTY OI has not confirmed yet, a bullish BANKNIFTY trade has elevated probability because bank stocks tend to follow the broader market.
Stoxra execution: Stoxra provides separate option chain views for NIFTY and BANKNIFTY. Open both, compare OI structure, and identify divergences. The AI mentor can analyse both chains and highlight when their signals conflict. Premium OI heatmaps make the visual comparison even faster by showing both chains side by side. Compare both chains free →
Five Strategies. One Platform. Zero Risk to Learn.
Every strategy above can be practised on Stoxra's paper trading platform with live NIFTY and BANKNIFTY option chain data. Build pattern recognition before you risk real capital.
How to Adjust Each Strategy for NIFTY vs BANKNIFTY
These two indices share the same option chain structure but behave very differently. Applying identical rules to both is a recipe for inconsistency. Here is how each strategy needs to be calibrated per index.
| Strategy | NIFTY adjustment | BANKNIFTY adjustment | Stoxra tool |
|---|---|---|---|
| OI Trap Detection | Traps build over 1–2 sessions. Unwind is gradual. Look for 10–15% OI decrease at key strike. | Traps build and unwind much faster — often within 60 minutes. Look for 25%+ OI decrease. | Premium OI heatmap shows multi-session trap patterns |
| IV Skew Edge | Skew widens slowly. Best read at 9:30 AM before it stabilises for the day. | Skew can shift sharply intraday due to banking sector news. Re-check at 11:00 AM and 1:30 PM. | IV displayed per strike on free. Premium highlights skew anomalies. |
| OI Buildup Continuation | Buildup accumulates over 2–3 hours. Reliable by mid-session. | First 30 minutes often define the buildup direction for the day. Act faster. | Change-in-OI indicators on free. Premium heatmap shows intensity. |
| Expiry-Day Pin | Gravitates reliably toward max pain in final 2–3 hours. Pin range typically within 50 points. | More volatile pin. Can overshoot max pain by 100–200 points before reverting. Wider stops needed. | Premium auto-calculated max pain for both indices. |
| Dual-Index Divergence | NIFTY usually leads. Its OI signal is the primary direction. | BANKNIFTY usually lags and then catches up. Trade BANKNIFTY in NIFTY OI's direction. | Separate chain views on free. Premium side-by-side comparison. |
All 5 Strategies Compared: Difficulty, Timing, and Best Use Case
| Strategy | Difficulty | Best timing | Win rate potential | Risk level | Stoxra tier |
|---|---|---|---|---|---|
| OI Trap Detection | Advanced | First 30 min after open | High (when identified correctly) | Medium (contrarian = needs discipline) | Premium (heatmap essential) |
| IV Skew Edge | Medium | Pre-market + intraday checkpoints | Medium-high | Low (used as a filter, not standalone entry) | Free IV data. Premium skew alerts. |
| OI Buildup Continuation | Easy-Medium | After first hour of session | Medium-high (trend-aligned) | Low (trading with institutional flow) | Free change-in-OI. Premium heatmap. |
| Expiry-Day Pin | Easy | Expiry day, last 3 hours | High (statistically strong near expiry) | Medium (expiry volatility can spike) | Premium (max pain calculation needed) |
| Dual-Index Divergence | Medium | Morning analysis, execute mid-session | Medium | Low-medium | Free (both chain views). Premium for heatmap compare. |
For beginners, start with OI Buildup Continuation (easiest) and Expiry-Day Pin (highest win rate). Add IV Skew Edge as a filter once comfortable. Graduate to OI Trap Detection and Dual-Index Divergence after 50+ paper trades on Stoxra. The progression matters because each strategy builds on understanding developed by the previous one.
How These Strategies Play Out in Real Indian Market Sessions
01
Thursday Expiry: NIFTY pins within 30 points of max pain
At 9:15 AM, NIFTY opens 180 points above max pain. OI data shows heavy call OI at the current level but massive put OI building 200 points lower near max pain. By 1:00 PM, NIFTY has drifted 120 points lower. By 2:30 PM, it settles within 30 points of max pain. Traders who used the Expiry-Day Pin strategy on Stoxra captured a clean directional move by simply trading toward the level where the math favoured settlement.
02
Monday morning: OI trap on BANKNIFTY 52,000 call strike
On Friday afternoon, 1.2 crore OI appeared at the BANKNIFTY 52,000 call strike — creating an apparent resistance wall. Retail traders expected 52,000 to hold on Monday. But by 9:45 AM Monday, 40% of that OI had unwound. Price pushed through 52,000 with volume. Traders using the OI Trap Detection strategy on Stoxra Premium saw the overnight spike and rapid unwind on the OI heatmap and positioned for the breakout instead of the bounce.
03
Wednesday midweek: NIFTY bullish OI + BANKNIFTY lagging
At 10:00 AM, NIFTY's option chain showed aggressive put OI building at 24,200 (bullish positioning) while BANKNIFTY's chain still had balanced call/put OI with no clear direction. By 11:30 AM, BANKNIFTY began confirming the bullish direction with fresh put OI building at 51,500. Traders using the Dual-Index Divergence strategy entered BANKNIFTY longs 90 minutes early — before BANKNIFTY's own OI confirmed — and captured the move that NIFTY's OI had already predicted.
These scenarios are the kind you can practise on Stoxra every single session. Open the option chain, read the data, make a decision, paper trade the execution, and let the AI mentor review whether your OI interpretation was correct. Over 30 days, you build the pattern recognition that turns raw data into real edge. Start practising free →
7 Errors That Turn Option Chain Data Into Losing Trades
Trusting static OI without checking change-in-OI. A strike with 50 lakh OI that lost 15 lakh today is weaker than one with 30 lakh OI that gained 10 lakh. Stoxra shows both side by side.
Using pre-open BANKNIFTY OI for the entire session. BANKNIFTY OI can restructure in 30 minutes. Re-check at 9:45 AM and 11:00 AM minimum. Stoxra updates live.
Ignoring IV when buying options. High IV means inflated premiums. Even a correct directional trade loses money if IV crushes after entry. Stoxra displays IV at every strike.
Treating every high-OI strike as unbreakable. OI creates probability, not certainty. When OI starts unwinding at a level, the wall is crumbling. Trade the unwinding, not the wall.
Using max pain on non-expiry days. Max pain is only relevant in the final 1–2 days before settlement. Using it on Monday gives misleading targets because the OI structure will change by Thursday.
Analysing 20+ strikes instead of 5–7. Information overload destroys decision quality. Focus only on the strikes nearest to ATM. Stoxra auto-centres on ATM and highlights only the significant levels.
Never reviewing whether your OI read was correct. Without a journal, you cannot measure your option chain reading accuracy. Stoxra's trade journal lets you tag every trade with "OI-based" and review whether OI predictions matched outcomes over time. That data is how you improve. Journal guide →
Why Stoxra's Option Chain Is Built Different — and How It Gives You an Edge
Most platforms dump the NSE option chain into a table and call it a feature. Stoxra redesigned the entire experience for Indian retail traders who want to actually trade from OI data, not just stare at it.
Visual OI Chain
NIFTY & BANKNIFTY with colour-coded OI bars. Support and resistance visible in 2 seconds. Free on every account.
Open chain →Change-in-OI Tracking
Green/red indicators show fresh positioning at every strike. See where money is flowing right now, not yesterday.
See live OI →AI OI Analysis
The AI mentor reads the option chain with you and explains what the data suggests in plain language.
Ask AI →Paper Trading
Practise all 5 strategies against live data. Build your OI reading accuracy before risking a rupee.
Practise free →Advanced Charts
VWAP, EMA, volume overlays alongside option chain data. Make OI-informed decisions with price confirmation.
Open charts →Strategy-Tagged Journal
Tag every trade with its strategy. Track which OI strategy performs best for you over 30, 60, and 90 days.
Guide →Competitions
Prove your OI analysis under competitive pressure. Systematic OI readers consistently top the leaderboard.
Join →Market News
Events that can cause OI earthquakes — RBI decisions, global cues, sector-specific news. Stay prepared.
Read news →Read the Option Chain Like an Institution. Trade Like a Professional.
Stoxra gives you the visual OI chain, change-in-OI tracking, AI analysis, and paper trading — free. Premium adds the institutional layer: OI heatmaps, IV skew alerts, max pain, PCR trends, and real-time shift notifications.
Frequently Asked Questions
What option chain strategy works best for NIFTY weekly expiry?
The Expiry-Day Pin strategy works exceptionally well for weekly expiries. It uses max pain as a magnet and combines it with OI concentration at nearby strikes to identify the most probable settlement zone. Stoxra Premium auto-calculates max pain for both NIFTY and BANKNIFTY.
How do institutional traders use the option chain differently from retail?
Institutions build OI walls at strikes they expect to defend, shift OI intraday to adjust positioning, and sometimes create OI traps to lure retail traders into false breakouts. Stoxra's change-in-OI tracking and Premium OI heatmaps help beginners spot these institutional patterns before they become costly.
What is IV skew and how can I use it for NIFTY and BANKNIFTY?
IV skew is the imbalance in implied volatility between equidistant OTM calls and puts. Wide put skew signals institutional fear of downside. Stoxra displays IV per strike on free accounts and highlights skew anomalies automatically on Premium.
Is BANKNIFTY option chain more useful than NIFTY for intraday?
BANKNIFTY OI data tends to be more actionable intraday because shifts happen faster and premiums move more. But faster shifts also mean faster invalidation. Stoxra provides real-time change-in-OI optimised for each index's speed of change.
Can Stoxra help me practise option chain strategies without real money?
Yes. Stoxra's paper trading uses live NSE data for NIFTY and BANKNIFTY option chains. Analyse OI, make directional decisions, execute paper trades — all at zero risk. Premium adds AI scoring on your analysis accuracy and execution quality.
The Option Chain Is a Battlefield. Stoxra Gives You the Map.
Most Indian retail traders enter NIFTY and BANKNIFTY options positions based on chart patterns, tips, or gut feeling — completely ignoring the richest data source available to them. The five strategies in this guide change that. Institutional OI Trap Detection keeps you on the right side of manufactured levels. IV Skew Edge gives you a volatility-based directional filter. OI Buildup Continuation lets you ride institutional momentum. Expiry-Day Pin gives you the highest-probability Thursday trade. And Dual-Index Divergence turns NIFTY and BANKNIFTY disagreements into actionable setups.
All of this runs on data that Stoxra's option chain displays visually, updates in real-time, and analyses with AI. The free account gives you highlighted OI zones, change-in-OI tracking, IV data, and paper trading. Premium adds the institutional layer that separates informed traders from the crowd: OI heatmaps, IV skew alerts, max pain, PCR trends, and real-time shift notifications.
The starting point is one free account and five minutes with the option chain before tomorrow's session. The strategies are here. The data is live. The platform is ready. The only variable left is you.
🔑 Key Takeaway
See What Institutions See. Trade With Data. Start Free on Stoxra.
Open the NIFTY and BANKNIFTY option chain on Stoxra with visual OI, live IV, and AI analysis. Upgrade to Premium for heatmaps, skew alerts, max pain, and real-time institutional shift notifications.
Stoxra Sitemap