
Nifty Option Chain Analysis Strategy for Weekly Expiry Trading (2026)
12 Mar 2026
14 min read
The definitive guide to PCR for Indian traders — covering OI-based vs volume-based PCR, the 4-checkpoint intraday monitoring system, divergence signals, expiry-day behaviour, and 5 actionable PCR trading strategies with specific entry, exit, and stop-loss rules for NSE in 2026.
Every Nifty option contract is a bet. A call option is a bet that the market will rise. A put option is a bet that it will fall. The Put-Call Ratio measures the balance between these two bets — and in doing so, it reveals the collective sentiment of every participant in the Nifty options market, from retail traders to the largest institutions and FIIs operating on NSE.
Most traders learn that PCR above 1 is bearish and below 1 is bullish — and then wonder why their trades based on this simplistic reading keep losing money. The reality is far more nuanced. PCR is a contrarian indicator seen through the lens of option sellers, not buyers. When PCR is high, it does not mean the market will fall — it means put sellers (typically institutions with significant capital) are aggressively selling puts, betting the market will not fall. That is a bullish signal, not a bearish one.
This single misunderstanding is why most PCR guides online produce losing strategies. They explain PCR from the buyer's perspective when the market is driven by sellers. Professional Indian traders read PCR from the seller's perspective — and this guide will teach you to do the same.
Beyond the basic interpretation, this guide covers what no competitor guide does: the difference between OI-based and volume-based PCR (and when to use each), the 4-checkpoint intraday monitoring system, PCR divergence signals, how PCR behaves differently on Tuesday expiry vs non-expiry days, and five complete PCR-based trading strategies with specific rules. Everything is tuned for the Nifty 50 on NSE and can be practised on Stoxra's option chain tools at zero cost.
The #1 PCR Mistake: Reading PCR from the buyer's perspective. High PCR does not mean "more people expect the market to fall." It means more puts have been sold — and in India's options market, the seller is typically the institutional "smart money." Heavy put selling means institutions expect the market to stay above current levels. This is bullish, not bearish. Reframe your entire PCR reading through the seller's lens, and your accuracy will improve dramatically.
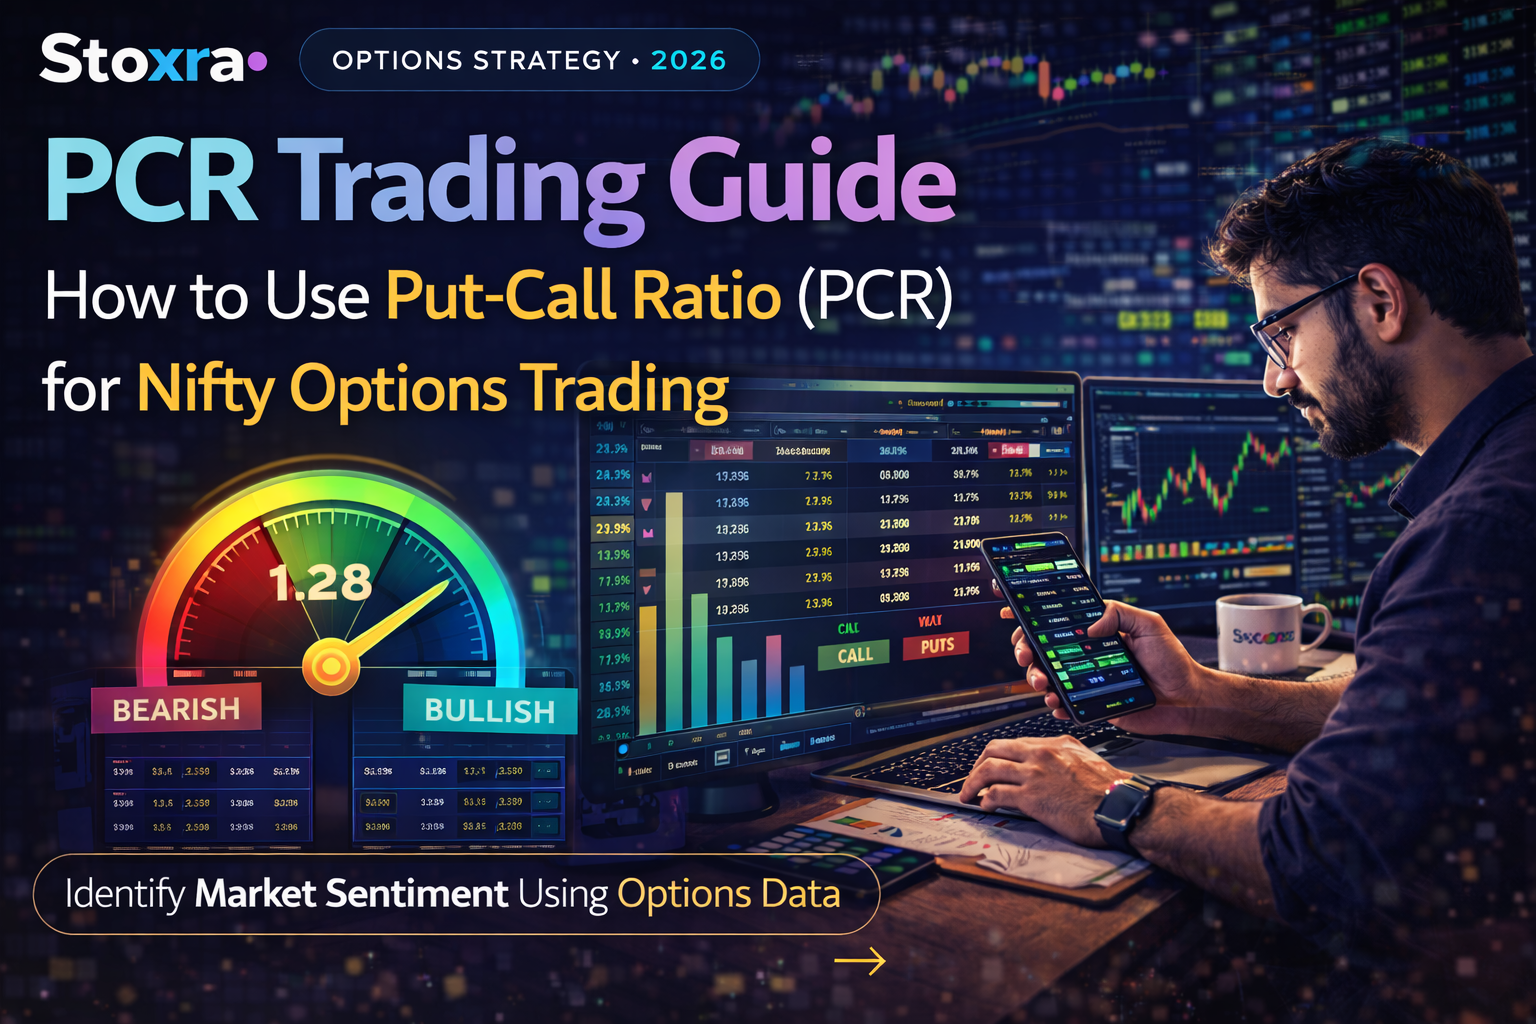
The Put-Call Ratio is calculated by dividing the total put option open interest (or volume) by the total call option open interest (or volume) across all active Nifty strike prices. The formula is simple: PCR = Total Put OI ÷ Total Call OI. If there are 15 lakh put contracts and 10 lakh call contracts outstanding, the PCR is 1.5.
But interpreting this number is where most traders go wrong — because the interpretation depends entirely on whether you view it from the buyer's or seller's perspective.
High PCR → more puts are being bought → traders expect the market to fall → bearish. This interpretation is straightforward but incorrect for Indian markets because the buyer's view ignores a critical fact: for every put that is bought, someone sells it. And in the Nifty options market, the seller is almost always the institution or "smart money" with deeper pockets, better information, and a longer time horizon.
High PCR → more puts have been sold → put sellers (institutions) have committed capital betting the market will stay above current levels → they will defend these levels with hedging and position management → bullish. This is the lens through which professional Indian traders read PCR. High PCR is bullish because it reflects institutional confidence in the floor. Low PCR is bearish because it reflects institutional call selling (creating a ceiling).
| PCR Range | Buyer's View (Common) | Seller's View (Professional) | Actual Market Tendency |
|---|---|---|---|
| Above 1.3 | Very bearish | Very bullish — extreme put writing | Market often bounces / stays up |
| 1.0 – 1.3 | Mildly bearish | Bullish — put sellers confident | Bullish bias |
| 0.7 – 1.0 | Bullish | Neutral to mildly bearish — balanced | Neutral / sideways |
| Below 0.7 | Very bullish | Bearish — aggressive call writing, ceiling being built | Market often stalls / falls |
If you have been using PCR as a direct sentiment indicator (high PCR = sell, low PCR = buy), you have been trading against institutional positioning. Switching to the seller's perspective — high PCR = buy, low PCR = sell — aligns you with smart money instead of against it. This single reframe can transform your PCR-based trading results. Every strategy in this guide uses the seller's perspective.
There are two ways to calculate PCR, and each tells you something different. Using the wrong one for your trading timeframe is a common reason for false signals. Most online guides treat them as interchangeable — they are not.
| Metric | OI-Based PCR | Volume-Based PCR |
|---|---|---|
| Formula | Total Put OI ÷ Total Call OI | Total Put Volume ÷ Total Call Volume |
| What It Measures | Accumulated positioning over multiple days | Today's trading activity only |
| Stability | Stable — changes gradually | Volatile — can swing wildly intraday |
| Best For | Positional / swing trading (2-7 days) | Intraday trading (same day) |
| Signal Quality | High — reflects institutional commitment | Medium — includes speculative retail volume |
| Noise Level | Low — filters out daily noise | High — especially on expiry days |
| When to Check | End of day, for next-day planning | Every 30-60 min during session |
Smart traders do not choose between OI PCR and volume PCR — they use OI PCR for the directional bias and volume PCR for intraday timing. The workflow is straightforward: check OI PCR at the end of each day to determine whether the overall bias is bullish, bearish, or neutral. Then during the next session, use volume PCR to time entries and exits within that bias. For example, if OI PCR is 1.15 (bullish bias), and during Tuesday's session the volume PCR dips to 0.75 (temporary bearish shift), that is a buying opportunity — the intraday dip is against the larger bullish positioning and is likely to reverse.
On Tuesday expiry, volume PCR becomes extremely unreliable after 1:00 PM. Retail traders flood in with cheap OTM option buys (lottery-ticket trades), and institutions rapidly unwind positions — both of which distort volume data. After 1:00 PM on expiry day, rely on OI PCR and price action instead of volume PCR. This is a trap that catches even experienced traders — the volume PCR can show extreme readings that have zero predictive value in the final hours of expiry. Learn more about expiry-specific dynamics in our Nifty weekly expiry strategy guide.
Checking PCR once at market open and ignoring it for the rest of the day misses the most actionable information. PCR is dynamic — it shifts throughout the session as new positions are created and old ones are closed. Professional Nifty traders use a 4-checkpoint system that captures the key sentiment shifts during the trading day.
After the first 15 minutes of opening volatility settle, check both OI PCR and volume PCR. The OI PCR reflects overnight positioning plus the opening adjustments. The volume PCR shows the initial directional conviction of the session. Record both numbers. This is your baseline. If OI PCR is above 1.0 and volume PCR is also above 1.0, the session starts with bullish conviction. If they diverge (OI bullish, volume bearish), the morning is likely choppy — wait for convergence before trading.
By 11:00 AM, the first major trading phase is complete. Check volume PCR again. If it has moved in the same direction as OI PCR since 9:30 AM, the morning bias is confirmed — you can take positions with higher confidence. If volume PCR has reversed direction from the 9:30 AM read, the morning move may be exhausting — tighten stops on existing positions or wait for the next checkpoint.
The lunch session (12:00-1:00 PM) often resets intraday dynamics as volume dips and new institutional positioning begins for the afternoon session. At 1:00 PM, check volume PCR. A fresh shift here — especially a sharp move of 0.15+ in either direction from the 11:00 AM read — signals the afternoon's direction. This is the most actionable checkpoint for afternoon trades. On non-expiry days, the 1:00 PM PCR read often predicts the 2:00-3:00 PM price direction with high reliability.
Check OI PCR for the final time. The end-of-day OI PCR sets the baseline for the next session. If OI PCR has risen during the day, bullish positioning is building — next day starts with a bullish bias. If OI PCR has fallen, bearish positioning is building. Record this value in your trading journal — it becomes Checkpoint 1's reference for the next session.
The direction of PCR change between checkpoints matters more than the absolute value at any single checkpoint. A PCR rising from 0.85 to 1.05 across checkpoints 1-3 is more bullish than a PCR that started at 1.10 but dropped to 1.00. Track the trend, not just the number. Stoxra's market analytics track PCR direction throughout the session automatically.
PCR does not exist in a vacuum. The same PCR value has different meanings depending on whether the market is trending, range-bound, or approaching expiry. This matrix — which no competitor guide provides — gives you the complete context-dependent interpretation.
| Market Condition | PCR Rising | PCR Falling | PCR Extreme High (>1.3) | PCR Extreme Low (<0.7) |
|---|---|---|---|---|
| Nifty Uptrend | Strong bullish — put writers confident in continuation | Caution — momentum may slow, call writers getting active | Potential exhaustion — consider trailing stop-loss tighter | Bearish divergence — reversal risk is high |
| Nifty Downtrend | Bullish divergence — institutions buying the dip via put writing | Strong bearish — call writers aggressive, expect more downside | Capitulation bottom likely — potential reversal zone | Panic intensifying — not yet bottomed |
| Range-Bound | Leaning bullish — break to upside more likely | Leaning bearish — break to downside more likely | Range may hold — heavy put writing creates floor | Range may hold — heavy call writing creates ceiling |
| Tuesday Expiry | Morning: bullish. After 1PM: noise — use with caution | Morning: bearish. After 1PM: noise — switch to OI + price action | If morning: strong floor. If afternoon: settlement artifact | If morning: ceiling pressure. If afternoon: ignore — distorted |
The key insight from this matrix: PCR interpretation is not fixed. The same PCR reading can be bullish in a downtrend (divergence = potential reversal) and cautionary in an uptrend (extreme = potential exhaustion). Always pair the PCR reading with the current market trend before making a trading decision.
PCR divergence occurs when PCR moves in the opposite direction to Nifty's price. It is the single most powerful signal PCR can produce — because it reveals that institutional positioning is shifting before the price move confirms it. Most traders only see reversals after they happen. PCR divergence lets you see them forming.
Setup: Nifty price is falling (or making lower lows), but PCR is rising (or making higher lows). What it means: Even though Nifty is dropping, put sellers are increasing their positions — they are aggressively selling puts at lower levels, betting the decline will not continue. This institutional buying of the dip via put writing often precedes a bounce. Action: Begin looking for long entries. Use technical indicators (VWAP bounce, EMA support, RSI oversold) to time the entry. PCR divergence provides the "why" (institutions are positioning for a bounce), technical analysis provides the "when" (the exact entry point).
Setup: Nifty price is rising (or making higher highs), but PCR is falling (or making lower highs). What it means: Despite the rally, call writers are increasing their positions — they are selling calls at higher levels, betting the rise will not continue. The rally is running into institutional resistance. Action: Begin tightening stop-losses on long positions. Avoid adding new longs. If technical indicators confirm resistance (price rejected at VWAP, RSI bearish divergence), consider short entries.
Compare Nifty's price direction with PCR direction across your 4 checkpoints. If at 9:30 AM Nifty was at 22,600 and PCR was 0.90, and by 1:00 PM Nifty has dropped to 22,500 but PCR has risen to 1.05 — that is bullish divergence forming within the session. The price is falling but put sellers are becoming more aggressive, not less. This intraday divergence often resolves with a bounce in the 2:00-3:00 PM window. Track these signals on Stoxra's live PCR dashboard alongside the Nifty chart.
PCR behaves fundamentally differently on Tuesday expiry compared to non-expiry days. Understanding these differences prevents you from acting on false signals when the stakes — and the volatility — are highest.
The most reliable PCR data point for Tuesday expiry trading is actually from Monday's close — not Tuesday morning. Monday's closing OI PCR reflects the fully positioned institutional stance going into expiry, before the distortions of Tuesday's settlement dynamics begin. If Monday's closing PCR is above 1.1, institutions are positioned bullishly for Tuesday. If below 0.8, they are positioned bearishly. Use Monday's close as your directional bias and only adjust if Tuesday morning data (before 11 AM) strongly contradicts it. Read our complete weekly expiry framework for the full 3-phase cycle.
These are five complete, ready-to-use strategies — each with specific entry conditions, exit rules, and stop-loss parameters. No competitor guide provides this level of actionable detail for PCR trading.
Concept: Use PCR direction to confirm an existing Nifty trend before entering. Entry: Nifty is above its 20 EMA on the 15-min chart (uptrend). OI PCR is above 1.0 and rising across checkpoints 1-2. Volume PCR is also above 1.0 at checkpoint 2. All three conditions confirm bullish momentum. Buy ATM or slightly OTM Nifty call option. Stop-loss: Exit if Nifty breaks below the 20 EMA or if PCR drops below 0.85 at the next checkpoint. Target: The highest call OI strike as resistance. Best for: Non-expiry days (Wednesday-Monday) when trends are cleaner.
Concept: Trade reversals identified by PCR divergence before the price confirms. Entry for bullish divergence: Nifty is falling and makes a new intraday low, but PCR at checkpoint 3 is higher than checkpoint 1. Wait for price to bounce above the VWAP line on the 5-min chart. Once VWAP is reclaimed, buy an ATM call option. Stop-loss: Below the intraday low by 30 points. Target: Previous session's high or the highest put OI strike. Best for: Mid-session reversals on non-expiry days. This is the highest risk-reward PCR strategy — divergence setups have a lower win rate (around 45-50%) but the winners are typically 2-3x larger than the losers.
Concept: When PCR reaches extreme levels, fade the crowd. Entry for bullish extreme (PCR > 1.4): This is unusual in this guide because extreme high PCR is typically bullish. However, when PCR is extremely high AND Nifty price has already rallied 200+ points in the session, it can signal exhaustion. Wait for the first red candle that closes below VWAP on the 5-min chart. Buy ATM puts. Entry for bearish extreme (PCR < 0.5): When PCR is extremely low and Nifty has already fallen 200+ points, institutions may be over-positioned in calls. Wait for the first green candle above VWAP. Buy ATM calls. Stop-loss: 40% of premium. Target: 100% of premium (double your money). Best for: Rare high-conviction setups — occurs 2-3 times per month.
Concept: Trade the next day's opening direction based on PCR shift between previous close and current open. Entry: At Monday's close, OI PCR is 0.90. On Tuesday at 9:30 AM, OI PCR has shifted to 1.10 (a 0.20 bullish shift overnight). This massive shift indicates that institutional positioning changed significantly during the overnight/pre-market period — likely due to global cues or FII activity. Buy ATM calls at 9:30 AM. Stop-loss: Exit if by 11:00 AM the PCR shift reverses (drops back below 1.0). Target: The call OI resistance level. Minimum shift threshold: 0.15 or more to trigger this strategy. Anything less is noise.
Concept: Use PCR for directional bias and VWAP for precise entry timing. Entry: Check PCR at checkpoint 1 (9:30 AM). If OI PCR is above 1.0, set a bullish bias for the session. Then wait for Nifty to pull back to VWAP on the 5-min chart. When price touches VWAP and bounces with volume, AND the volume PCR at that moment is still above 0.9, buy an ATM call option. Stop-loss: Below VWAP by 25 points. Target: Previous swing high or 1.5x the stop-loss distance. Best for: Every regular (non-expiry) session. This is the most consistent PCR strategy because it combines sentiment (PCR), value (VWAP), and momentum (volume bounce) into a single high-probability setup.
| Strategy | Win Rate Range | Risk-Reward | Frequency | Difficulty |
|---|---|---|---|---|
| PCR Trend Confirmation | 55-65% | 1:1.5 | 2-3x per week | Beginner-friendly |
| PCR Divergence Reversal | 45-50% | 1:2.5 | 1-2x per week | Intermediate |
| PCR Extreme Contrarian | 50-55% | 1:2 | 2-3x per month | Intermediate |
| PCR Shift Overnight | 55-60% | 1:1.5 | 1-2x per week | Beginner-friendly |
| PCR + VWAP Combined | 58-65% | 1:1.5 | 3-4x per week | Intermediate |
PCR is a sentiment indicator — it tells you what institutions are doing. Technical indicators tell you when to act. The most profitable PCR-based trades combine sentiment with timing. Here are the most effective combinations for Nifty trading:
PCR provides the bias (bullish or bearish). VWAP provides the entry point (buy on VWAP bounce in bullish PCR, sell on VWAP rejection in bearish PCR). This is the #1 combination used by professional Nifty intraday traders. Covered in detail as Strategy 5 above and in our best intraday indicators guide.
When both PCR and RSI are pointing in the same direction, the signal is significantly stronger. PCR above 1.0 (bullish) + RSI above 50 and rising = strong bullish confirmation. PCR below 0.8 (bearish) + RSI below 50 and falling = strong bearish confirmation. The PCR divergence signal becomes even more powerful when RSI also shows divergence — this double divergence setup is one of the highest-conviction reversal signals available.
PCR tells you the aggregate sentiment. OI at specific strikes tells you the key levels. When PCR is bullish (above 1.0) AND the highest put OI is at a specific strike (say 22,500), you know exactly where institutional support is. If Nifty pulls back to 22,500, you have both the aggregate sentiment (PCR bullish) and the specific level (put OI support at 22,500) confirming a long entry. This combination is covered in depth in our Nifty option chain reading guide.
India VIX measures market-wide implied volatility. When PCR is at an extreme AND India VIX is also at an extreme (above 18-20), the market is under stress — and extreme stress often resolves with sharp reversals. A PCR above 1.4 combined with VIX above 20 is a strong contrarian buy signal. A PCR below 0.5 combined with VIX spiking is a strong contrarian sell signal. VIX adds the "fear gauge" context that makes extreme PCR readings even more actionable.
The single biggest mistake. High PCR is not bearish — it reflects heavy put selling by institutions who expect the market to stay up. Switch to the seller's perspective as explained in Section 1, and your PCR reads will immediately become more accurate.
PCR tells you sentiment, not timing. Trading based on PCR alone — without technical confirmation like VWAP, EMA, or RSI — produces too many false signals. Always combine PCR with at least one timing indicator before entering a trade.
PCR shifts throughout the session. A single reading at 9:15 AM misses the most actionable information — the direction of change across checkpoints. Use the 4-checkpoint system to track how sentiment evolves intraday, not just where it starts.
Volume PCR becomes distorted on Tuesday expiry afternoon due to retail speculative volume and institutional unwind activity. After 1:00 PM on expiry, switch to OI PCR and price action. Volume PCR in the final hours is noise.
There is no magic number. PCR of 1.2 does not always mean "buy." The interpretation depends on whether the market is trending or ranging, whether it is expiry or non-expiry, and — most importantly — the direction of PCR change. Context-dependent interpretation, as covered in the matrix in Section 4, is essential for accuracy.
PCR is reliable only for high-liquidity instruments — Nifty 50 and Bank Nifty. Individual stock options often have thin OI, where a single large order can swing the PCR dramatically and create false signals. Stick to index PCR for the most accurate sentiment read. Practise on Stoxra's paper trading platform to build confidence before going live.
Every strategy in this guide requires real-time PCR data, OI analysis, and a risk-free environment to practise. Stoxra provides all of this — purpose-built for Indian traders who want to trade Nifty options with intelligence.
Real-time Nifty OI PCR and volume PCR updated throughout the session. Track direction changes across the 4-checkpoint system without manual calculation.
Full Nifty option chain with OI, change in OI, IV, volume at every strike. See where institutions are positioned alongside the PCR data.
Real-time max pain level for Nifty weekly and monthly expiry. Combine with PCR for the complete sentiment + positioning picture.
₹10 lakh virtual capital with live NSE data. Practise all 5 PCR strategies risk-free across multiple weekly cycles before trading real money.
Ask about current PCR meaning, divergence signals, or strategy suitability. Get contextual AI analysis that combines PCR with price action and OI data.
50+ indicators including VWAP, EMA, RSI — the technical timing tools that convert PCR sentiment into precise trade entries.
India VIX, FII/DII flows, sector heat maps — the macro context that determines whether extreme PCR readings signal reversals or continuations.
Structured courses on options, PCR, OI analysis, and derivatives strategies. Build the knowledge foundation before applying the strategies.
Whether you are checking PCR for the first time or refining a divergence-based reversal strategy, Stoxra gives you every tool, every data point, and every learning resource — free. Explore AI-powered trading, compare AI vs manual approaches, and read our complete Bank Nifty option chain guide.
The most common questions about using PCR for Nifty options trading.
For Nifty, PCR historically oscillates between 0.7 and 1.3. A PCR above 1.0-1.2 is generally bullish (from the seller's perspective — heavy put writing supports the market). Below 0.7 is generally bearish. Extreme readings above 1.5 or below 0.5 often signal potential reversals. The direction of PCR change matters more than the absolute value.
Use both. OI-based PCR for positional and swing trading bias — it shows accumulated institutional positioning and is more stable. Volume-based PCR for intraday timing — it reflects real-time sentiment shifts. Professional traders monitor OI PCR for directional bias and volume PCR for entry timing. Stoxra displays both metrics in its option chain tools.
Use the 4-checkpoint system: 9:30 AM (baseline), 11:00 AM (confirmation), 1:00 PM (afternoon setup), and 2:30 PM (closing outlook). On Tuesday expiry days, check every 30 minutes before 1:00 PM. After 1:00 PM on expiry, PCR becomes unreliable — switch to price action and OI levels.
PCR divergence occurs when PCR moves opposite to Nifty's price. Bullish divergence: Nifty falling but PCR rising — institutions buying the dip via put writing, expect a bounce. Bearish divergence: Nifty rising but PCR falling — institutions selling into the rally via call writing, expect a stall. Divergence is the most powerful PCR-based early reversal signal. Combine it with VWAP and RSI for timing.
Yes. Stoxra provides free real-time Nifty PCR data alongside its paper trading simulator with ₹10 lakh virtual capital. Monitor PCR, apply the strategies from this guide, and track results across multiple weeks. The AI mentor can explain PCR movements and suggest setups based on current conditions.
The Put-Call Ratio is not just another indicator on your screen. It is the closest thing retail traders have to reading institutional minds. When you understand that PCR reflects what sellers are doing — not what buyers are hoping — the entire Nifty options market becomes more legible. High PCR means institutions are building a floor. Low PCR means they are building a ceiling. Divergence means they are positioning for a move the price has not yet confirmed.
The 4-checkpoint system gives you a structured process for monitoring PCR throughout the session instead of glancing at it once. The OI vs volume PCR distinction ensures you are using the right metric for your trading timeframe. The interpretation matrix prevents you from applying the same PCR reading identically across different market conditions. And the five strategies give you specific, testable setups with clear entry, exit, and stop-loss rules.
But reading about PCR is not the same as trading with it. Practise the 4-checkpoint system for two weeks without trading — just observe and record. Then paper trade each strategy for at least 20 occurrences. Track your results. Identify which strategies match your trading style. Then — and only then — apply them with real capital.
The data is free. The tools are available. The institutional positioning is visible in every option chain update. The only question is whether you will learn to read it.
Track Nifty PCR in real time on Stoxra — live data, AI mentor, paper trading, and advanced charts. Zero capital required to start.
Advertisement