Fibonacci Retracement Explained: How Traders Use It | Stoxra
Learn how Fibonacci retracement works, how to draw key Fibonacci levels, and how traders use them to identify potential support, resistance and pullback zones.
Fibonacci Retracement Explained: How Traders Use It
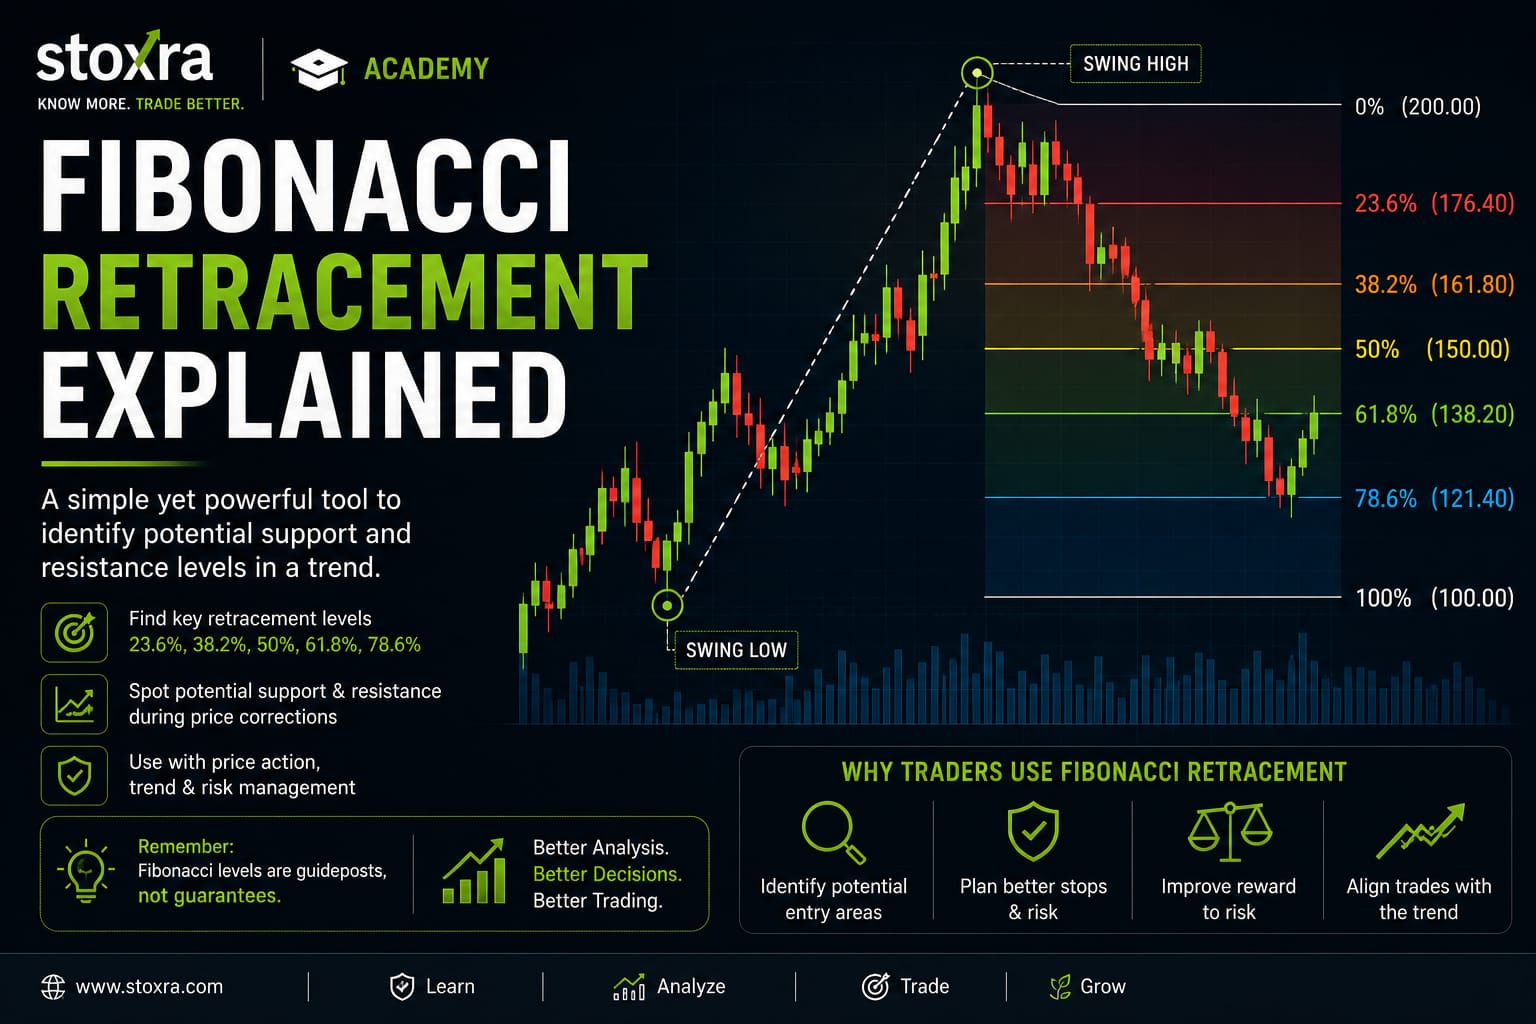
Fibonacci Retracement is a popular technical-analysis tool used by traders to identify potential support and resistance areas during a price correction.
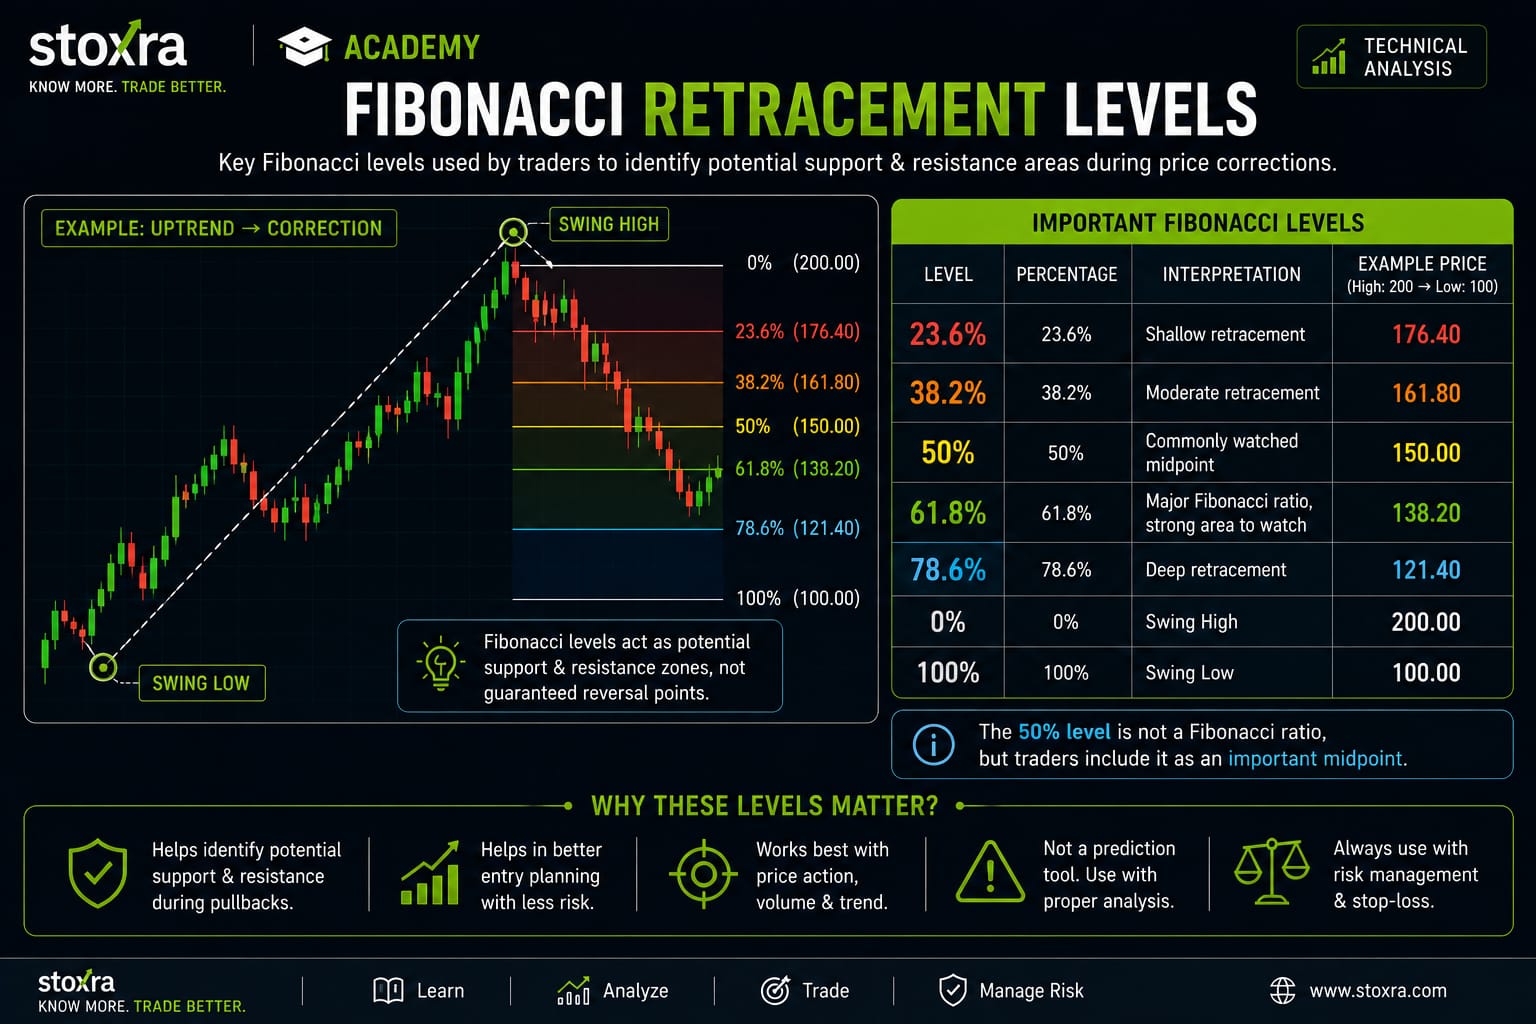
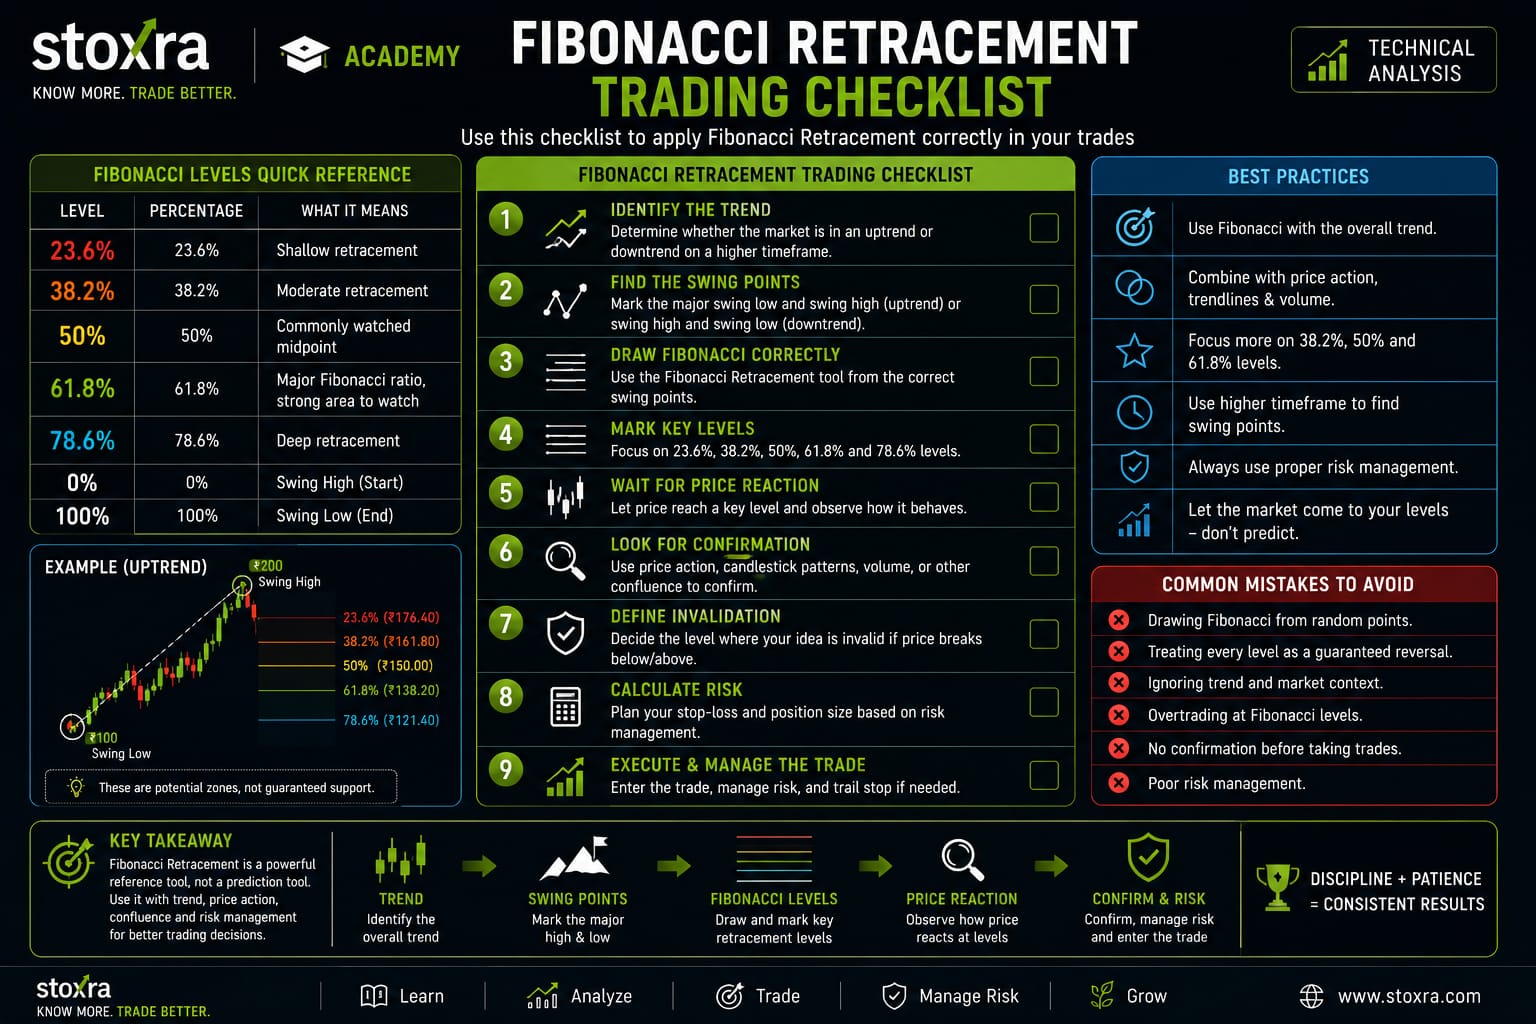
It is based on ratios derived from the Fibonacci sequence. The most commonly watched levels are 23.6%, 38.2%, 50%, 61.8% and 78.6%.
These levels do not guarantee that price will reverse. Instead, they can act as reference zones that traders combine with price action, trend, volume and risk management.
For a broader understanding of the technical-analysis framework, traders can also explore technical analysis in stock trading and review basic stock market terminology before using technical indicators.
Key Takeaway
Fibonacci Retracement is a reference tool, not a guaranteed prediction system. The commonly watched levels are 23.6%, 38.2%, 50%, 61.8% and 78.6%. Traders should combine Fibonacci levels with trend, price action, volume, support and resistance, market context and predefined risk-management rules rather than treating any single level as a guaranteed reversal point.
What Is Fibonacci Retracement?
Fibonacci Retracement measures how much of a previous price move has been retraced. It is commonly used during corrections within an existing market trend.
In an uptrend, traders generally draw the tool from a significant swing low to a swing high. In a downtrend, it is generally drawn from a swing high to a swing low.
The resulting levels can help traders identify areas where price may pause, consolidate or react.
Understanding broader trend behaviour is important because Fibonacci levels are more useful when studied in the context of the prevailing market direction.
Beginners can also build their foundation with stock market basics before moving into more advanced technical-analysis concepts.
Why Do Traders Use Fibonacci Retracement?
Markets do not always move in a straight line. Even during a strong trend, prices can temporarily move against the prevailing direction.
Fibonacci Retracement provides traders with predefined reference levels for studying these pullbacks.
Instead of trying to predict the exact point where a correction will end, traders can observe how price behaves around important Fibonacci levels.
This makes Fibonacci more useful as a structured technical-analysis tool rather than as a standalone buy or sell signal.
Traders should also understand common stock market mistakes beginners make so that technical indicators are not used without a proper plan.
Important Fibonacci Retracement Levels
| Level | Common Interpretation |
|---|---|
| 23.6% | Shallow retracement |
| 38.2% | Moderate retracement |
| 50% | Commonly watched midpoint |
| 61.8% | Major Fibonacci ratio |
| 78.6% | Deep retracement |
The 50% level is not technically a Fibonacci ratio, but traders commonly include it in Fibonacci Retracement tools.
When evaluating any technical setup, traders can also compare the underlying business and market information with qualitative and quantitative stock analysis where appropriate.
How to Draw Fibonacci Retracement
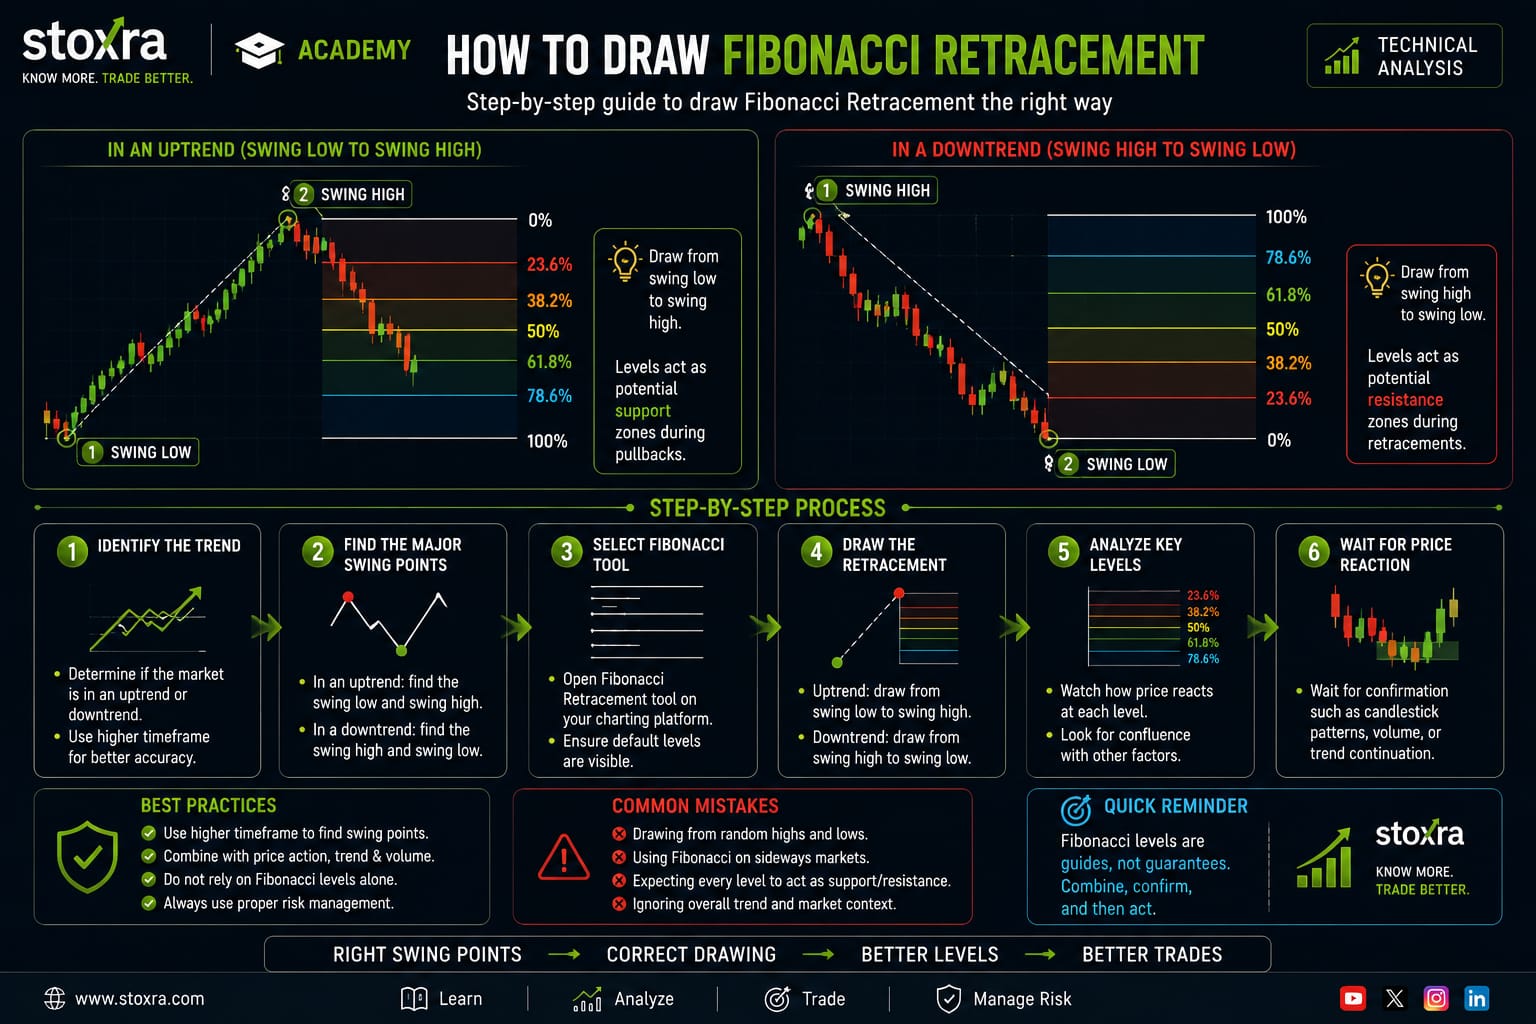
Correctly selecting the swing points is important when using Fibonacci Retracement. The tool should generally be drawn between significant price extremes rather than random highs and lows.
In an Uptrend
Identify a meaningful swing low and a subsequent swing high. Draw the Fibonacci tool from the low toward the high and observe the levels during the subsequent correction.
In a Downtrend
Identify a meaningful swing high and a subsequent swing low. Draw the Fibonacci tool from the high toward the low and observe potential resistance during a recovery.
Traders should avoid selecting arbitrary points because changing the swing points can also change the resulting Fibonacci levels.
Understanding candlestick patterns can also help traders interpret price behaviour around important Fibonacci zones.
Fibonacci Retracement Example
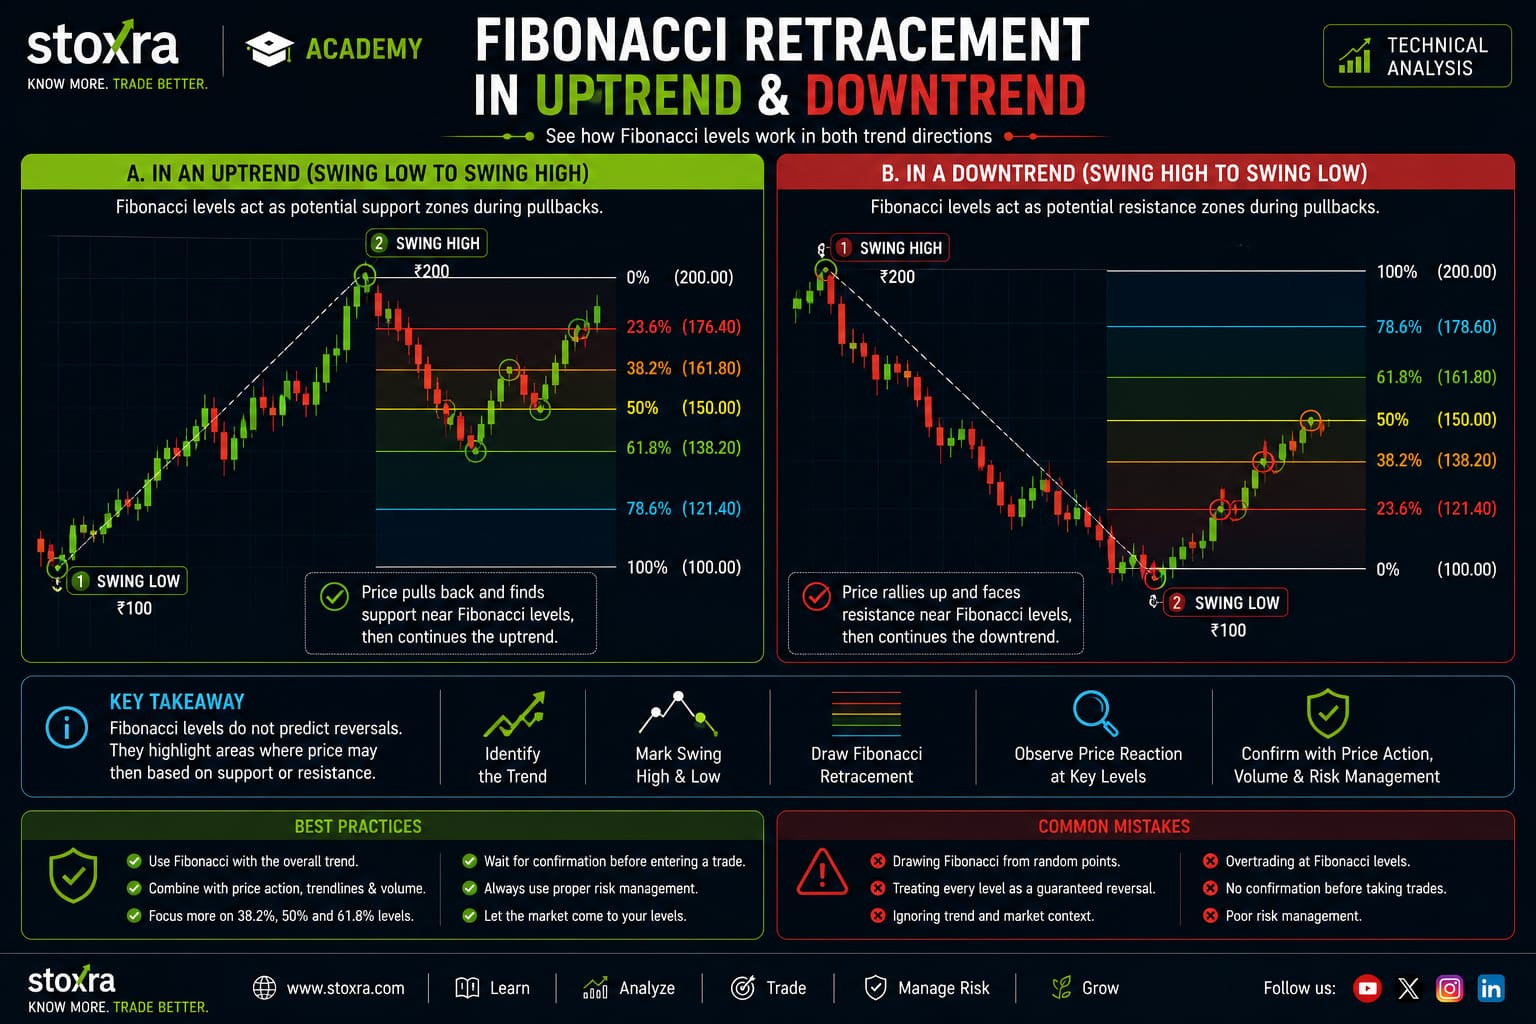
Suppose a stock moves from ₹100 to ₹200.
The total price movement is:
₹200 − ₹100 = ₹100
The approximate retracement levels from the high are:
- 23.6% → ₹176.40
- 38.2% → ₹161.80
- 50% → ₹150.00
- 61.8% → ₹138.20
- 78.6% → ₹121.40
These values represent potential reference levels. They are not guaranteed support or resistance levels.
For traders interested in broader price and trend analysis, concepts such as the 100-day moving average can provide additional context.
Fibonacci in an Uptrend
During an uptrend, traders may use Fibonacci levels to observe potential support during a pullback.
Uptrend → Pullback → Fibonacci Level → Price Reaction → Confirmation
Traders may look for additional evidence such as previous support, candlestick patterns, volume or other technical factors.
Candlestick behaviour can provide additional confirmation when price reaches an important Fibonacci zone.
Another useful price-and-volume reference for intraday analysis is VWAP trading strategy.
Fibonacci in a Downtrend
Fibonacci Retracement can also be used during a downtrend.
A trader can measure the move from a significant swing high to a swing low and then observe potential resistance levels if price starts recovering.
A Fibonacci level should not automatically be interpreted as a reversal signal.
Instead, traders can compare Fibonacci levels with existing support and resistance zones to look for areas where multiple forms of evidence overlap.
Fibonacci and Price Action
Fibonacci levels can become more useful when combined with price action.
For example, suppose price reaches the 61.8% level and also approaches a previous support zone. If a bullish price-action pattern appears, a trader may pay closer attention to that area.
This combination of multiple forms of evidence is often called confluence.
The objective is not to assume that Fibonacci will predict the reversal, but to see whether price behaviour confirms the technical setup.
A structured trend-following approach can also help traders understand how a Fibonacci pullback fits within a broader trend.
Fibonacci and Volume
Volume analysis can provide additional context when price reaches a Fibonacci level.
For example, a strong price rejection from a Fibonacci zone accompanied by increased volume may deserve more attention than a weak reaction occurring on unusually low volume.
However, volume should always be interpreted together with the broader market context.
Fibonacci Retracement vs Fibonacci Extension
| Feature | Retracement | Extension |
|---|---|---|
| Purpose | Study potential correction levels | Study potential price objectives beyond the original move |
| Common use | Support and resistance during pullbacks | Potential targets |
| Direction | Measures retracement of an existing move | Projects levels beyond the original range |
Learn more about target planning with our Fibonacci Extension guide.
Can Fibonacci Predict the Exact Price?
No. Fibonacci Retracement should not be treated as an exact prediction tool.
Price can reverse before reaching a Fibonacci level, move through it, or react briefly before continuing in the same direction.
Its main value is as a structured reference framework for analysing potential price zones.
This is why technical tools should be used as part of a broader process rather than as isolated prediction mechanisms.
Fibonacci and Broader Market Trends
Fibonacci analysis should ideally be performed in the context of the broader market trend. A retracement in a strong uptrend can have a different interpretation from a similar retracement during a weak or declining market.
For additional market context, traders can review Sensex and Nifty market trend analysis alongside their individual chart analysis.
This can help traders avoid analysing a stock's Fibonacci levels in isolation from the overall market environment.
Common Mistakes When Using Fibonacci
- Drawing Fibonacci from random price points.
- Treating every Fibonacci level as guaranteed support or resistance.
- Ignoring the broader trend.
- Using Fibonacci without price-action confirmation.
- Ignoring volume and market context.
- Assuming the 61.8% level must always hold.
- Entering trades without defining risk.
- Using too many indicators without a clear trading plan.
Psychology also matters. Traders should understand how emotions such as FOMO can lead to trading mistakes when a price appears to react strongly from a technical level.
How Traders Can Use Fibonacci More Effectively
A disciplined approach is to use Fibonacci as one component of a broader technical-analysis process.
Trend → Swing Points → Fibonacci Levels → Price Reaction → Confirmation → Risk Management
This approach avoids treating a single Fibonacci level as an automatic buy or sell signal.
Traders can also compare Fibonacci-based setups with trend-following approaches when deciding how a technical setup fits into a broader strategy.
For traders using technology to support market analysis, AI tools for stock market analysis in India can also be explored as research and screening aids.
Fibonacci Retracement Trading Checklist
- ☑ Identify the broader trend.
- ☑ Find significant swing high and swing low.
- ☑ Draw the Fibonacci tool correctly.
- ☑ Mark important retracement levels.
- ☑ Observe the price reaction.
- ☑ Check price-action confirmation.
- ☑ Check volume when relevant.
- ☑ Define the invalidation level.
- ☑ Calculate potential risk.
- ☑ Follow the trading plan.
Risk should be defined before entering a trade. Traders can also learn about intraday risk management when applying technical setups to short-term trading.
Position sizing is another important part of risk control. Traders can explore position sizing for intraday trading to understand how trade size can affect portfolio risk.
Fibonacci, Risk Management and Drawdown
Even when a Fibonacci setup appears technically strong, the trade can fail. Therefore, the quality of the setup should not be confused with certainty of outcome.
Traders should define their acceptable loss before entering a position and avoid allowing one technical setup to create excessive portfolio exposure.
For a deeper understanding of controlling trading losses, readers can explore risk-management techniques to reduce drawdown.
For short-term traders, a predefined daily loss limit can also help prevent a series of unsuccessful trades from becoming an uncontrolled loss.
Fibonacci and Other Technical Indicators
Fibonacci does not need to be used alone. Traders may combine it with indicators that provide information about trend, momentum, volatility or volume.
For example, a trader may compare a Fibonacci retracement with a moving average, VWAP, volume behaviour or momentum indicator.
However, adding more indicators does not automatically make a strategy better. The objective should be meaningful confirmation rather than indicator overload.
Readers interested in indicator-based analysis can also explore popular indicators for options trading and understand how different indicators serve different analytical purposes.
Fibonacci Retracement and Trading Psychology
Technical analysis is only one part of trading. A trader may correctly identify a Fibonacci level but still make a poor decision because of fear, greed, impatience or overconfidence.
A predefined process can reduce emotional decision-making.
Traders interested in this subject can study trading psychology for beginners and learn why discipline is important when technical setups fail.
Using Fibonacci With a Trading Plan
Fibonacci works best when its role is clearly defined inside a trading plan.
A plan may specify:
- Which market or instrument will be analysed.
- Which timeframe will be used.
- How swing points will be selected.
- Which Fibonacci levels will be monitored.
- What confirmation is required.
- Where the setup becomes invalid.
- How much capital can be exposed to the trade.
This prevents traders from changing their rules simply because price moves against their expectations.
A useful related concept is trade expectancy versus win rate, which highlights why one successful setup does not determine the overall quality of a trading approach.
Fibonacci Retracement Trading Checklist for Beginners
Before using Fibonacci, ask:
- ☑ What is the current market trend?
- ☑ Have I selected meaningful swing points?
- ☑ Which timeframe am I analysing?
- ☑ Where are the important Fibonacci levels?
- ☑ Is there nearby support or resistance?
- ☑ Is price action confirming the level?
- ☑ Is volume providing useful confirmation?
- ☑ What would invalidate the setup?
- ☑ How much capital is at risk?
- ☑ Does this setup follow my trading plan?
Final Takeaway
Fibonacci Retracement is a useful technical-analysis tool for studying potential support, resistance and pullback zones.
The commonly watched levels are: 23.6%, 38.2%, 50%, 61.8% and 78.6%.
However, these levels are not guaranteed reversal points. The most useful approach is to combine Fibonacci with trend analysis, price action, volume, market context and appropriate risk-management principles.
Fibonacci should be used as a reference tool, not as a standalone prediction system.
Continue Learning With Stoxra
Build your understanding of technical analysis, trading concepts and market research through Stoxra Learn. You can also explore the STOXRA AI Trading Platform to learn how technology can support structured market analysis.
Frequently Asked Questions
What is Fibonacci Retracement?
Fibonacci Retracement is a technical-analysis tool used to identify potential price levels during a correction of an earlier market move.
What are the main Fibonacci Retracement levels?
The commonly used levels are 23.6%, 38.2%, 50%, 61.8% and 78.6%.
Is 50% a Fibonacci ratio?
No. The 50% level is not derived directly from the Fibonacci sequence, but traders commonly include it in Fibonacci Retracement tools.
Can Fibonacci guarantee a price reversal?
No. Fibonacci levels are reference zones and cannot guarantee that price will reverse.
How should traders confirm a Fibonacci level?
Traders can consider price action, previous support or resistance, volume, trend, momentum and other relevant market information.
Can Fibonacci be used in both uptrends and downtrends?
Yes. The tool can be applied to significant swings in both bullish and bearish trends.
What is the best way to use Fibonacci Retracement?
There is no single guaranteed method. A structured approach is to combine Fibonacci levels with trend, price action, support and resistance, volume and a predefined trading plan.
Disclaimer
This article is for educational and informational purposes only and does not constitute investment, financial or trading advice. Fibonacci Retracement levels do not guarantee future price movements or trading profits. Trading and investing involve market risk, and investors should conduct their own research and use appropriate risk management before making financial decisions.