How AI Identifies Chart Patterns Automatically
Learn how AI identifies stock chart patterns by analyzing price, volume and technical data, and understand how automated pattern recognition can support faster technical analysis while still requiring human confirmation and risk management.
How AI Identifies Chart Patterns Automatically
Reading stock charts manually can take considerable time.
Traders often look for patterns such as:
- Head and Shoulders
- Double Top
- Double Bottom
- Triangles
- Flags
- Wedges
- Support and resistance
- Breakouts
The challenge is that charts contain huge amounts of price data, and patterns are not always obvious.
This is where AI-based chart pattern recognition can help.
AI systems can process historical price and market data, identify recurring structures and highlight potential patterns much faster than a manual scan.
However, AI pattern recognition should be understood as an analytical aid rather than a guaranteed prediction system. Traders still need to evaluate market context, confirmation, liquidity, volume and risk.
Key Takeaway
AI can identify potential chart patterns quickly, but a detected pattern is not automatically a trading signal. Always verify the timeframe, price action, volume, support and resistance, market context and risk before making a decision.
For readers who are still building their foundation, the stock market terminology guide for beginners can help explain commonly used market concepts.
For a broader understanding of chart-based analysis, traders can also explore technical analysis in stock trading.
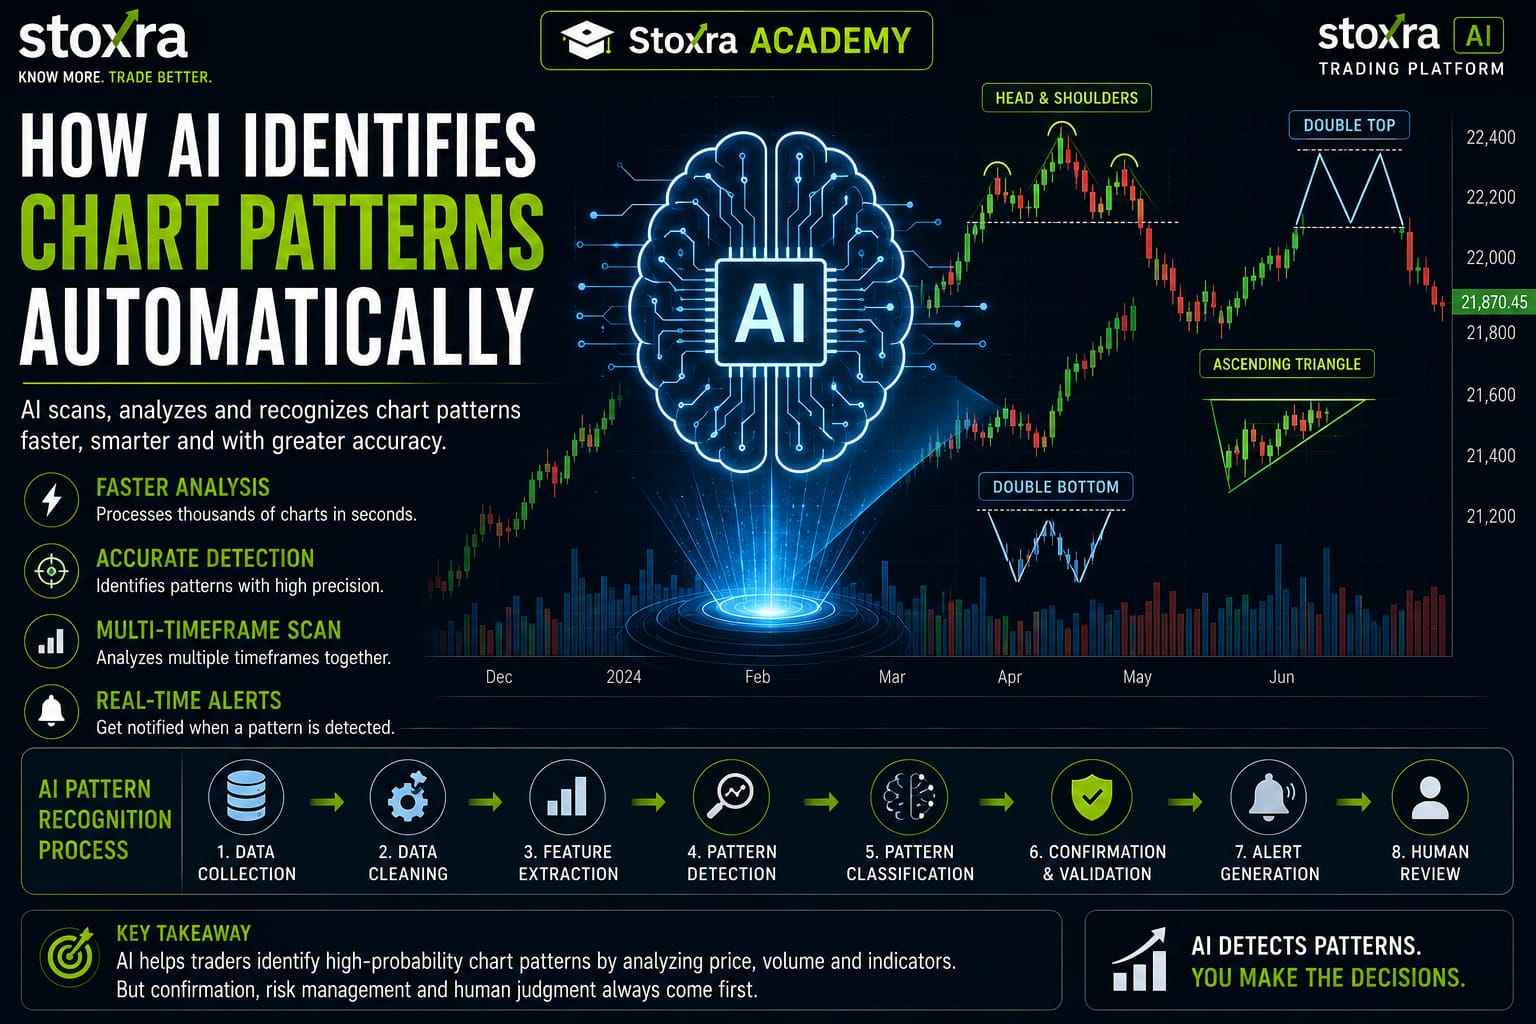
What Is AI Chart Pattern Recognition?
AI chart pattern recognition refers to the use of machine-learning or computer-vision techniques to identify potentially meaningful structures in financial market data.
An AI system may analyze:
- Open price
- High price
- Low price
- Close price
- Volume
- Price changes
- Historical patterns
- Technical indicators
- Market context
It can then search for structures that resemble patterns learned from historical data.
For example, instead of manually scanning hundreds of charts for a possible double bottom, an AI system can scan a large number of instruments and flag charts that contain characteristics associated with a double-bottom formation.
This approach can complement traditional candlestick pattern analysis, particularly when a trader needs to review many charts.
Beginners can also strengthen their foundation by reading the stock market basics guide before moving into automated technical analysis.
How Does AI Read a Stock Chart?
AI does not necessarily “see” a chart in exactly the same way a human trader does.
There are different approaches.
Approach 1: Raw Market Data
The system receives numerical OHLCV data:
Open → High → Low → Close → Volume
It then analyzes relationships between these values.
Approach 2: Technical Features
The system may calculate features such as:
- Moving averages
- RSI
- ATR
- Volatility
- Support levels
- Resistance levels
- Volume changes
For example, moving averages can provide additional context when an AI system evaluates the direction and structure of price movement. Traders can also study the 100-day moving average as an example of how a technical indicator can be used in chart analysis.
Another useful technical reference is the best indicators for options trading, particularly for readers interested in how indicators are combined with market context.
Approach 3: Chart Images
Some systems can treat a rendered candlestick chart as an image and use computer-vision techniques to recognize visual structures.
Approach 4: Hybrid Analysis
More advanced systems can combine price data, technical indicators and visual chart structures.
This type of analysis can also be connected with broader AI-based market-analysis workflows. Traders interested in the technology side can explore AI tools for stock market analysis in India.
Those interested in automated market technology can also learn more about algorithmic trading software in India.
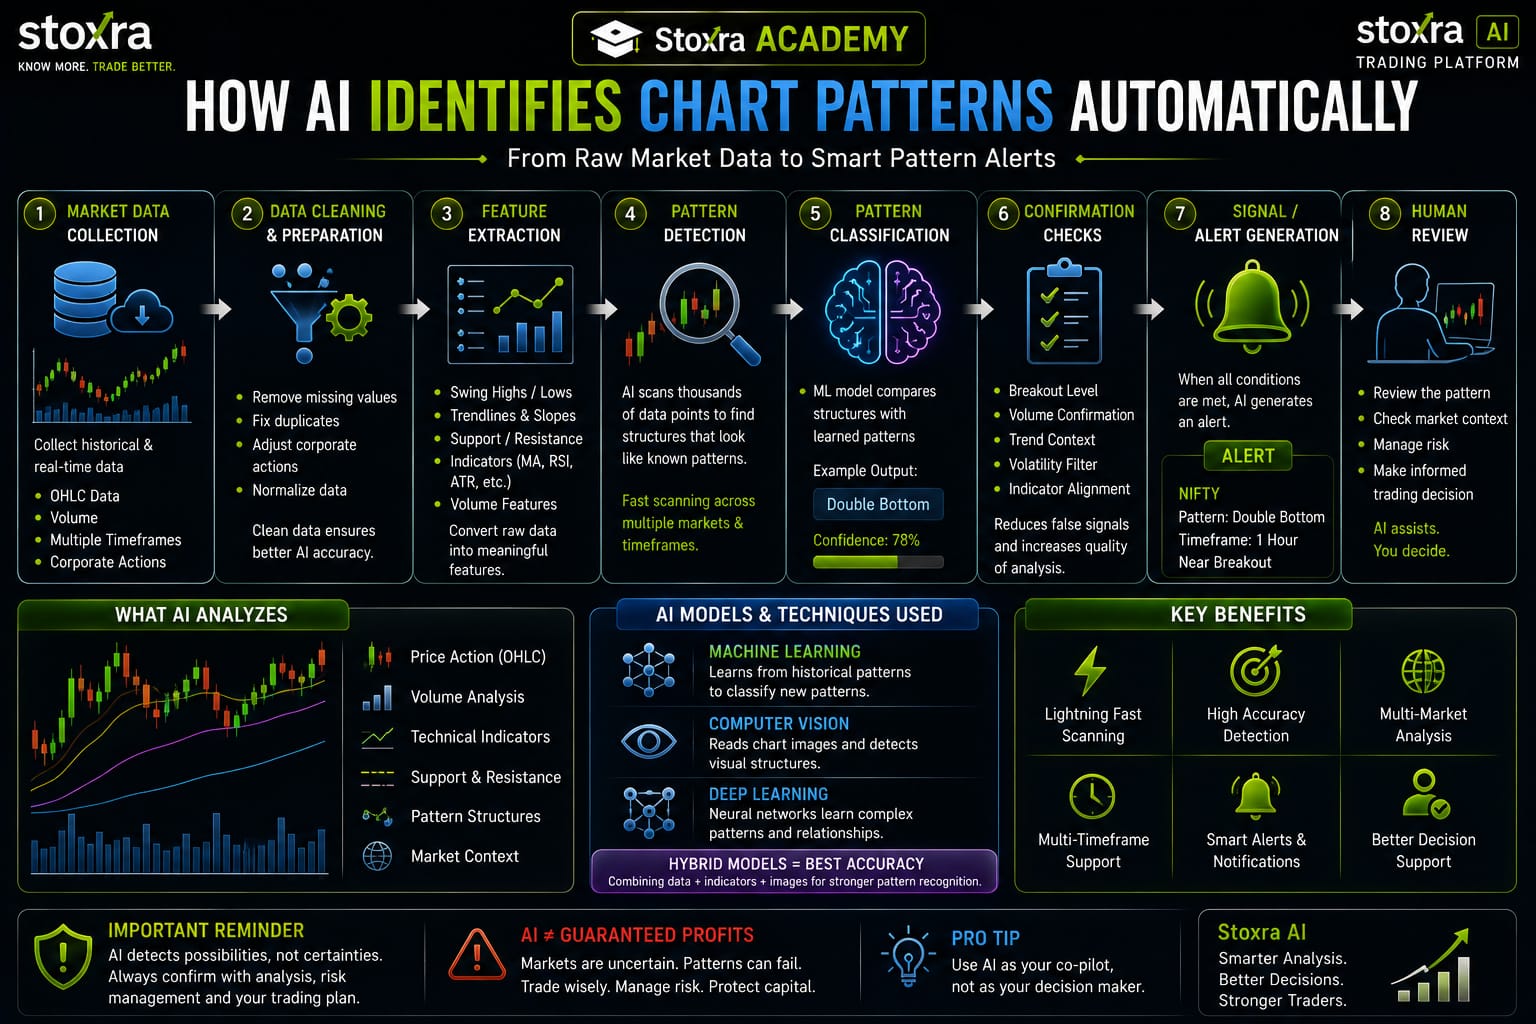
Step-by-Step: How AI Identifies a Pattern
A simplified AI pattern-recognition workflow looks like this:
Market Data
↓
Data Cleaning
↓
Feature Extraction
↓
Pattern Detection
↓
Pattern Classification
↓
Confirmation
↓
Signal / Alert
↓
Human Review
The exact process varies depending on the AI model and platform.
Step 1: Collect Market Data
The first requirement is reliable market data.
Depending on the application, this can include:
- Historical OHLC data
- Intraday data
- Volume
- Corporate-action adjustments
- Index data
- Multiple timeframes
For example, a system analyzing NIFTY may process historical candles across:
- 5-minute
- 15-minute
- 1-hour
- Daily
The timeframe matters because a pattern appearing on a 5-minute chart may not have the same significance as one appearing on a daily chart.
Step 2: Clean and Prepare the Data
Financial data can contain:
- Missing values
- Duplicate records
- Incorrect timestamps
- Corporate-action effects
- Data inconsistencies
Before an AI model analyzes the information, the data generally needs to be normalized and cleaned.
Poor-quality input can produce poor-quality output.
This is often summarized as:
Garbage in → garbage out.
Step 3: Detect Important Price Points
Many chart patterns depend on swing highs and swing lows.
An AI system can search for these points.
For example:
High → Pullback → Higher High → Pullback
or:
Low → Recovery → Lower Low → Recovery
These turning points can help the system construct a potential pattern.
Step 4: Extract Features
The AI system can convert raw price data into measurable features.
Examples include:
- Distance between highs
- Distance between lows
- Slope of trendlines
- Price range
- Volume changes
- Volatility
- Time between turning points
These features allow the model to compare the current structure with patterns observed in historical data.
Step 5: Recognize the Pattern
The system can then classify the structure.
For example:
Double Bottom
Potential structure:
Low → Recovery → Second Low → Breakout
Double Top
Potential structure:
High → Pullback → Second High → Breakdown
Head and Shoulders
Potential structure:
Left Shoulder → Head → Right Shoulder
Triangle
Potential structure:
Contracting price range → converging boundaries
The AI does not need to rely on a single visual clue.
It can evaluate multiple characteristics simultaneously.
How Machine Learning Helps
Machine learning models can learn relationships from historical examples.
Suppose a dataset contains thousands of historical charts.
Some examples are labelled:
Double Bottom
Others:
Double Top
Others:
No Clear Pattern
A supervised-learning model can be trained to distinguish between these categories.
After training, the model can evaluate new data and estimate which category the current structure most closely resembles.
The output might look conceptually like:
Double Bottom — 78% model confidence
However, this should not be interpreted as a 78% probability that the trade will be profitable.
Model confidence and trading probability are not necessarily the same thing.
This is one reason traders should avoid blindly following automated outputs. Understanding trading psychology for beginners can also help users manage overconfidence and emotional decision-making.
How Computer Vision Can Recognize Chart Patterns
Another approach is to use computer vision.
The system receives a chart image containing:
- Candlesticks
- Trendlines
- Price levels
- Volume bars
A vision model can search for visual structures.
For example, it may detect:
Shoulder → Head → Shoulder
and classify the formation as a potential head-and-shoulders pattern.
This approach is conceptually similar to image classification used in other fields, but financial charts have additional challenges because patterns can vary significantly in shape, scale and timeframe.
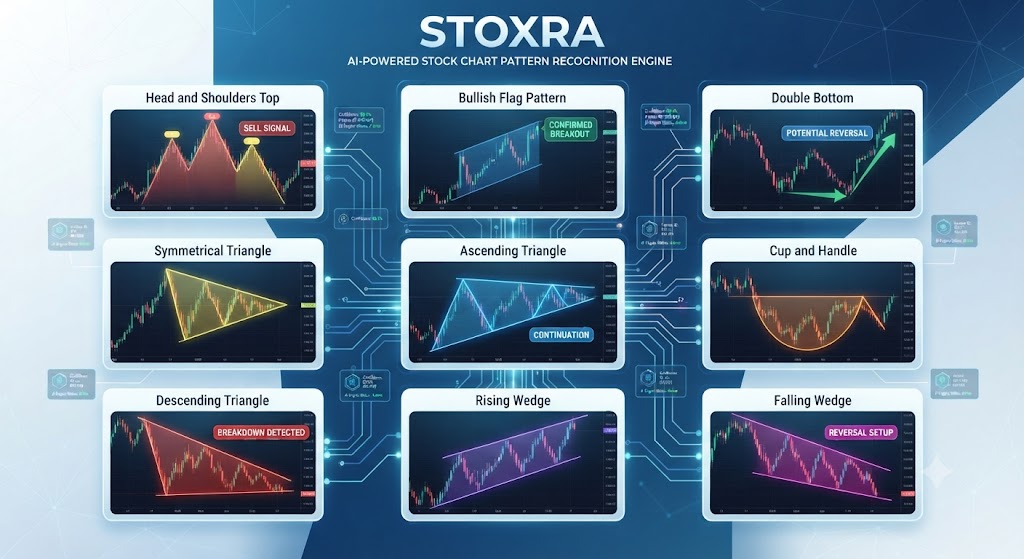
Common Patterns AI Can Detect
AI systems may be designed to recognize many common formations.
1. Head and Shoulders
Often associated with a potential reversal structure.
2. Inverse Head and Shoulders
The opposite visual configuration.
3. Double Top
Two significant highs separated by a pullback.
4. Double Bottom
Two significant lows separated by a recovery.
5. Ascending Triangle
Typically characterized by a relatively flat resistance area and rising lows.
6. Descending Triangle
Typically characterized by relatively flat support and declining highs.
7. Symmetrical Triangle
Converging higher lows and lower highs.
8. Flags
Short-term consolidation following a directional move.
9. Wedges
Price structures bounded by converging trendlines.
10. Support and Resistance
AI can also attempt to identify repeated price-reaction areas.
Support and resistance can become particularly useful when combined with other market information rather than being treated as isolated signals.
Traders who want to understand this concept in greater detail can explore support and resistance with market data.
AI Pattern Recognition and Volume
Price alone does not always tell the complete story.
Volume can provide additional context.
For example, a breakout accompanied by increased volume may be interpreted differently from a breakout occurring on unusually low volume.
An AI system can therefore incorporate volume features into its analysis.
A simplified framework could be:
Pattern + Breakout + Volume Confirmation
rather than:
Pattern = Automatic Buy Signal
This distinction is important.
Traders can also review intraday trading indicators to understand how technical indicators and volume can be combined with price analysis.
Another useful reference is the VWAP trading strategy, which explains how price and volume relationships can be studied during intraday analysis.
Multi-Timeframe Pattern Recognition
One of the useful capabilities of automated systems is scanning multiple timeframes.
For example:
Daily → 1-hour → 15-minute → 5-minute
A pattern may appear on one timeframe but not another.
An AI system can compare these structures and provide a broader context.
For example:
- Daily trend: bullish
- 1-hour: consolidation
- 15-minute: breakout formation
- 5-minute: short-term volatility
This can provide more information than analyzing a single chart alone.
Multi-timeframe analysis can be combined with a broader trend-following strategy framework when evaluating market direction.
AI and False Breakouts
One of the biggest challenges in technical analysis is the false breakout.
A price may appear to break resistance but quickly move back below the level.
An AI system can attempt to reduce false signals by evaluating additional information such as:
- Volume
- Candle structure
- Previous volatility
- Trend strength
- Momentum
- Historical breakout behavior
But no AI model can eliminate false breakouts completely.
Market behavior is uncertain.
Traders should also understand how emotional pressure can affect breakout decisions. The guide on how FOMO leads to trading mistakes is relevant when traders feel pressured to enter immediately after an apparent breakout.
AI Pattern Recognition vs Manual Analysis
| Feature | Manual Analysis | AI Analysis |
|---|---|---|
| Speed | Slower | Faster |
| Large-scale scanning | Difficult | Efficient |
| Pattern consistency | Depends on trader | Model-dependent |
| Multiple markets | Time-consuming | Can scan many |
| Human context | Strong | Depends on system |
| False signals | Possible | Possible |
| Final decision | Human | Should remain risk-controlled |
AI's biggest advantage is often speed and scale.
A trader might manually analyze 20 charts.
An automated system could potentially scan thousands of instruments, depending on its infrastructure and data availability.
For readers interested in the broader comparison between technology-driven and traditional approaches, algorithmic trading vs manual trading provides a related perspective.
Readers can also compare paper trading vs real trading to understand why testing an approach before risking capital can be useful.
Can AI Predict Stock Prices?
This is where traders need to be careful.
Pattern recognition is not the same as price prediction.
An AI system may identify:
“This chart resembles a double bottom.”
That does not mean:
“The stock will definitely rise.”
Markets are affected by:
- News
- Earnings
- Economic conditions
- Liquidity
- Investor sentiment
- Unexpected events
Therefore, AI pattern recognition should be viewed as an analytical tool, not a guaranteed prediction engine.
Fundamental context can also matter. Traders interested in combining business analysis with market data can learn about how to value a stock using fundamental analysis.
Another useful framework is qualitative vs quantitative analysis of stocks, which shows why price patterns are only one part of broader market research.
AI Pattern Recognition and Technical Indicators
AI can combine chart patterns with technical indicators.
For example:
Pattern: Double Bottom
RSI: Improving
Volume: Increasing
Resistance: Broken
The system can combine these features to produce a stronger analytical context.
But even multiple confirmations do not guarantee a profitable outcome.
Other indicator-based approaches can also be useful for context. For example, traders can study the VWAP trading strategy when evaluating price and volume relationships during intraday analysis.
For options-focused analysis, traders can also explore options trading risk management before applying technical signals to leveraged positions.
How AI Can Generate Pattern Alerts
A trading platform can continuously scan incoming market data.
When predefined conditions are detected, the system can generate an alert.
Example:
Potential Pattern Detected
Instrument: XYZ
Pattern: Ascending Triangle
Timeframe: 1 Hour
Status: Near Resistance
Volume: Above Recent Average
Action: Monitor for Confirmation
Notice the wording:
Monitor for Confirmation
rather than:
BUY NOW
This is a more responsible way to present automated analysis.
How Stoxra AI Could Use Pattern Recognition
For a platform such as Stoxra AI, chart-pattern recognition can be integrated into an educational and analytical workflow.
A possible workflow is:
Select Instrument
↓
Select Timeframe
↓
AI Scans Chart
↓
Potential Pattern Detected
↓
Pattern Explanation
↓
Support / Resistance
↓
Volume Context
↓
Confirmation Conditions
↓
Risk Information
This can help users understand why a pattern was detected rather than simply receiving a trading signal.
Readers who want to understand AI-driven market analysis more broadly can also explore how AI is transforming stock market trading in India.
Those looking for practical AI-based market tools can also explore AI trading strategies in India.
For a broader platform-level overview, readers can visit the STOXRA AI Trading Platform.
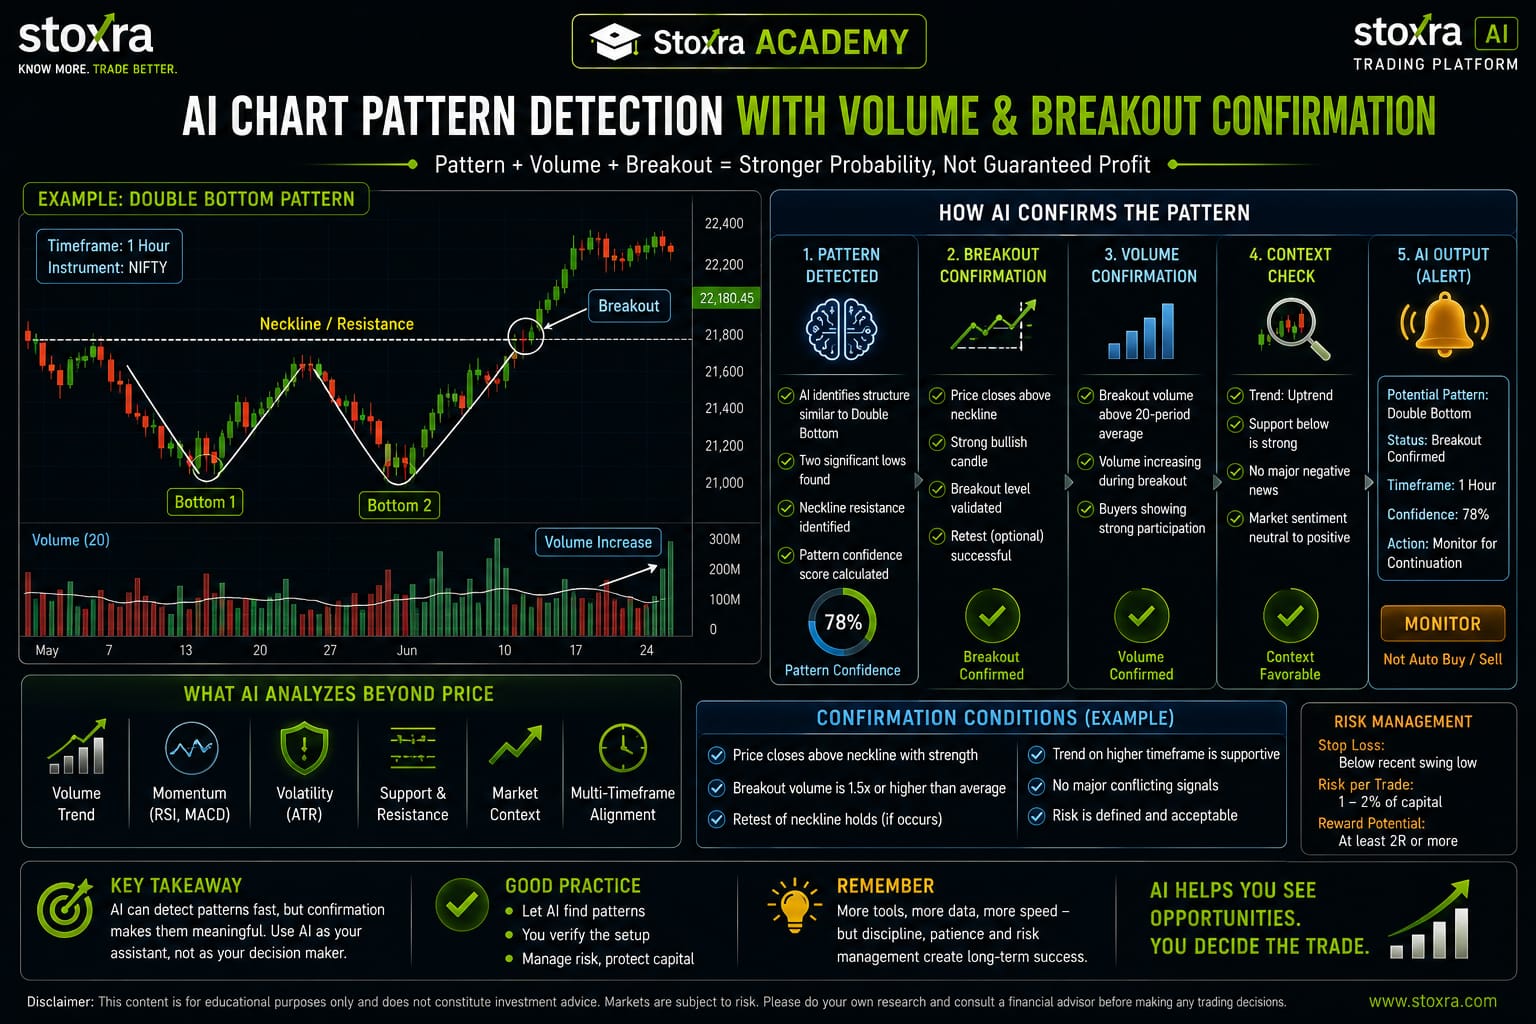
Example AI Pattern Analysis
Imagine an index has the following structure:
- First low near 21,800
- Recovery toward 22,000
- Second low near 21,820
- Price returns toward 22,000
- Volume increases during the recovery
An AI system may identify this as a potential double-bottom structure.
But the system should then ask:
- Has resistance actually broken?
- Is volume supporting the move?
- What timeframe is being analyzed?
- Is the broader trend consistent?
- What happens if the breakout fails?
This creates a more complete analysis.
Benefits of AI Chart Pattern Recognition
Faster Scanning
AI can analyze large numbers of charts quickly.
Consistency
The same programmed criteria can be applied repeatedly.
Multi-Market Analysis
Systems can scan multiple stocks, indices or other instruments.
Multi-Timeframe Analysis
Patterns can be checked across several timeframes.
Alerts
Potential formations can trigger notifications.
Educational Value
AI can explain why a particular structure resembles a known pattern.
For traders interested in improving position and risk decisions, understanding position sizing can complement AI-based pattern analysis.
Limitations of AI Chart Pattern Recognition
AI also has important limitations.
1. False Positives
A model may classify random price movements as a pattern.
2. False Negatives
A genuine pattern may not be detected.
3. Training Bias
A model trained on one market or period may perform differently in another.
4. Changing Market Conditions
Markets evolve.
Historical relationships may weaken.
5. Data Quality
Incorrect or incomplete data can affect the analysis.
6. Pattern Subjectivity
Different traders can interpret the same chart differently.
7. Overconfidence
Users may assume an AI-generated pattern is guaranteed to work.
That is dangerous.
Risk management should remain central to any automated or semi-automated trading workflow. Traders can review risk management techniques to reduce drawdown for additional context.
How to Use AI Pattern Recognition Responsibly
A sensible workflow is:
Step 1
Let AI scan the market.
Step 2
Review the detected pattern.
Step 3
Check the timeframe.
Step 4
Check support and resistance.
Step 5
Check volume and volatility.
Step 6
Look for confirmation.
Step 7
Calculate the potential risk.
Step 8
Decide whether the setup fits the trading plan.
This keeps AI in the role of decision support, rather than replacing risk management.
For practical risk controls, traders can also review intraday risk management for beginners.
Another useful concept is setting a daily loss limit for intraday trading, which can help prevent a sequence of poor decisions from escalating into uncontrolled losses.
Pro Tip
Use AI pattern recognition as a screening and confirmation tool rather than treating every detected formation as an automatic trade. The strongest workflow combines AI detection with timeframe analysis, price action, volume, market context and predefined risk-management rules.
Common Mistakes
Mistake 1: Treating Every Pattern as a Signal
A pattern is not automatically a trade.
Mistake 2: Ignoring the Timeframe
A 5-minute pattern and daily pattern can have very different contexts.
Mistake 3: Ignoring Volume
Breakouts without supporting participation can behave differently.
Mistake 4: Trusting AI Blindly
AI models can make mistakes.
Mistake 5: Ignoring Risk
Even a high-quality setup can fail.
Mistake 6: Overfitting
A model can perform extremely well on historical data while performing poorly on unseen market conditions.
Understanding these limitations is particularly important when evaluating any AI trading strategy.
Traders should also avoid letting fear of missing a move influence their decisions. Learning about FOMO trading mistakes can help explain why immediate action is not always the best response to an AI-generated alert.
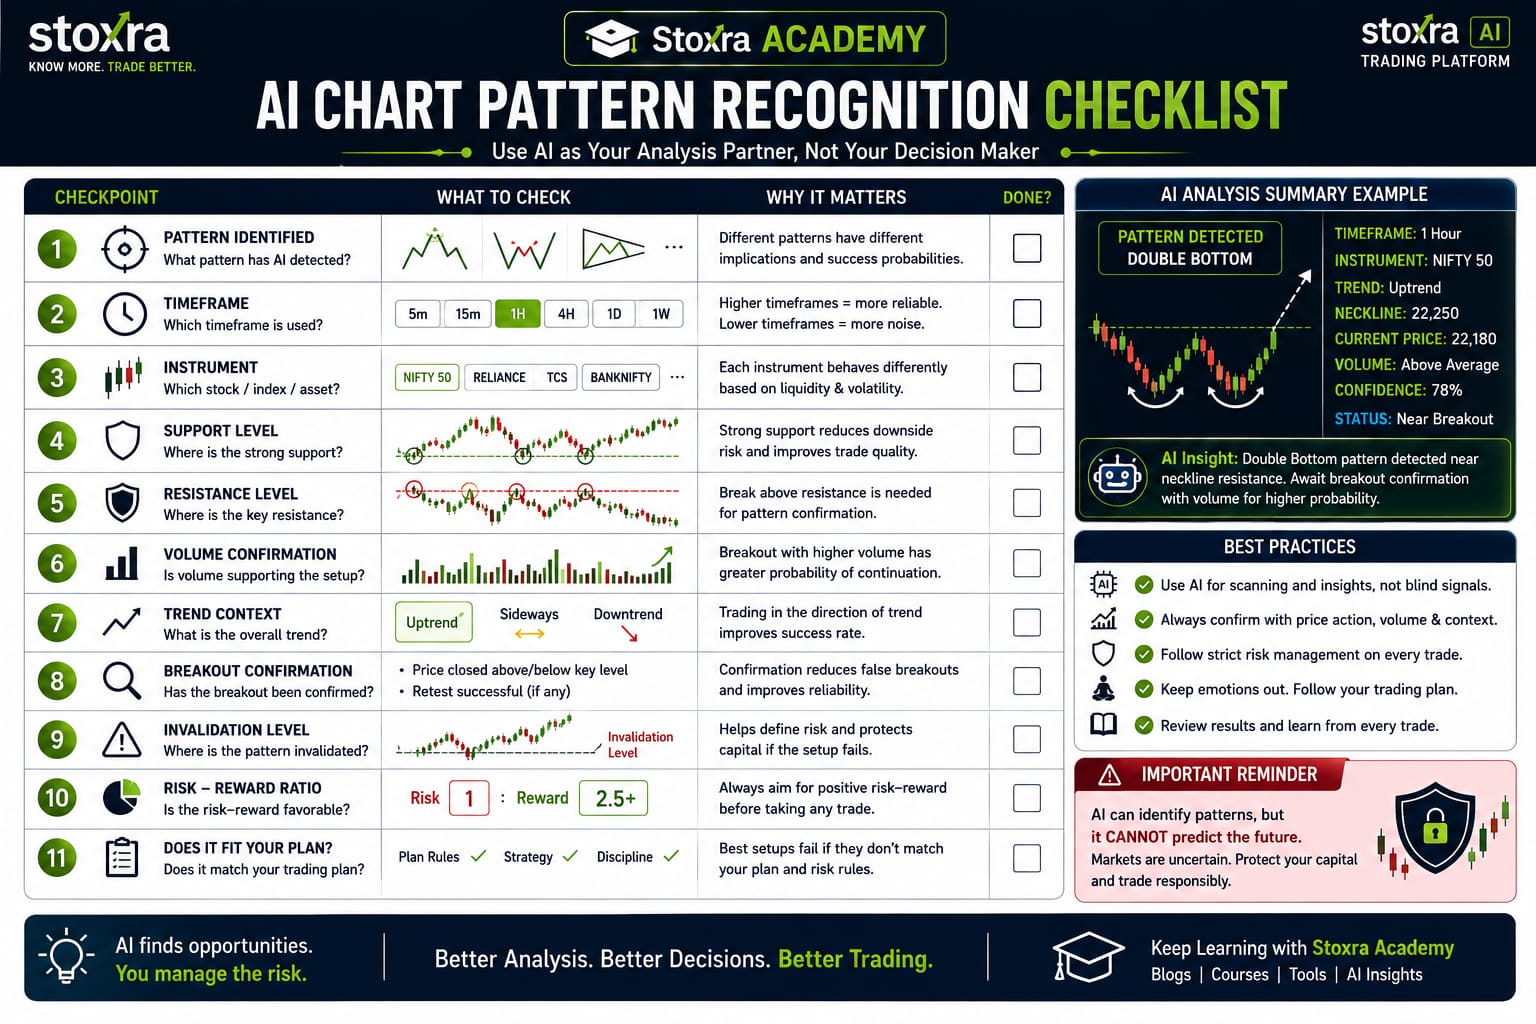
AI Pattern Recognition Checklist
Before acting on an AI-detected pattern, check:
- ☑ What pattern was detected?
- ☑ Which timeframe?
- ☑ Which instrument?
- ☑ Where is support?
- ☑ Where is resistance?
- ☑ Is volume confirming the move?
- ☑ Is the broader trend supportive?
- ☑ Is there a breakout confirmation?
- ☑ What is the invalidation level?
- ☑ What is the potential risk?
- ☑ Does the setup fit the trading plan?
Traders can also consider trade expectancy versus win rate when evaluating whether a trading approach has value over a larger sample rather than judging it from one successful or unsuccessful setup.
Final Takeaway
AI can make chart-pattern analysis significantly faster by processing large amounts of market data and identifying structures that resemble historical patterns.
It can help detect:
Head & Shoulders → Double Tops → Double Bottoms → Triangles → Flags → Wedges → Support & Resistance
But pattern recognition should not be confused with guaranteed prediction.
The most useful approach is:
AI Detection → Human Understanding → Confirmation → Risk Management → Decision
For an AI trading platform, the goal should not simply be to tell users “BUY” or “SELL.”
A better system explains:
- What pattern was detected
- Why it was detected
- What confirms it
- What could invalidate it
- What risks should be considered
That makes AI more useful as a decision-support and learning tool while keeping the trader responsible for the final decision.
Key Takeaway
AI chart pattern recognition is most useful when it helps traders scan markets faster and organize potential setups. It should support, not replace, human judgment, confirmation and risk management.
Continue Learning With STOXRA
Want to learn more about AI-driven market analysis and trading concepts? Explore STOXRA Learn for educational resources and explore the STOXRA AI Trading Platform for AI-focused market analysis.
Frequently Asked Questions
Can AI automatically identify chart patterns?
Yes. AI systems can be designed to analyze market data or chart images and identify structures that resemble predefined or learned patterns.
Can AI predict stock prices accurately?
Pattern recognition does not guarantee accurate price prediction. Markets contain uncertainty and can be affected by unexpected events.
Which chart patterns can AI detect?
Depending on the model, AI can detect patterns such as double tops, double bottoms, head and shoulders, triangles, flags, wedges and other technical structures.
Is AI better than human chart analysis?
AI is faster and can scan large numbers of charts, while humans can provide broader context and judgment. Combining both can be more useful than relying entirely on either one.
Does an AI-detected pattern guarantee profit?
No. Patterns can fail, and AI models can produce false positives or false negatives.
How should traders use AI chart-pattern signals?
Use them as analytical inputs. Confirm the pattern with market context, price action, volume and risk-management rules before making a trading decision.
Disclaimer
This article is for educational and informational purposes only and is not investment or trading advice. AI-generated pattern recognition can contain errors and does not guarantee future market performance. Trading and investing involve risk, and users should independently evaluate information before making financial decisions.