What Is Implied Volatility in Options Trading? | Stoxra
Understand implied volatility, its effect on option premiums, IV crush, volatility expectations and how traders can use IV alongside other options analysis tools.
What Is Implied Volatility in Options Trading?
Implied volatility, commonly called IV, is one of the most important concepts in options trading. It represents the market's expectation of how much the price of an underlying asset could move over a period of time.
Unlike historical volatility, which is calculated from past price movements, implied volatility is derived from current option prices. It is therefore closely connected to market expectations and option premiums.
Understanding IV can help traders interpret why an option premium may be expensive or cheap relative to the market's expected volatility. For a broader beginner-friendly explanation, traders can also explore implied volatility in options trading.
Before analysing options volatility, beginners may also benefit from understanding basic stock market terminology and the fundamentals of how financial markets work.
Key Takeaway
Implied volatility measures expected price movement, not direction. Higher IV generally means the options market is pricing in a larger potential move, while lower IV generally indicates a smaller expected move. IV should be analysed together with option premium, time to expiry, market conditions, liquidity and risk management. An increase in IV does not automatically mean that the underlying asset will rise or fall.
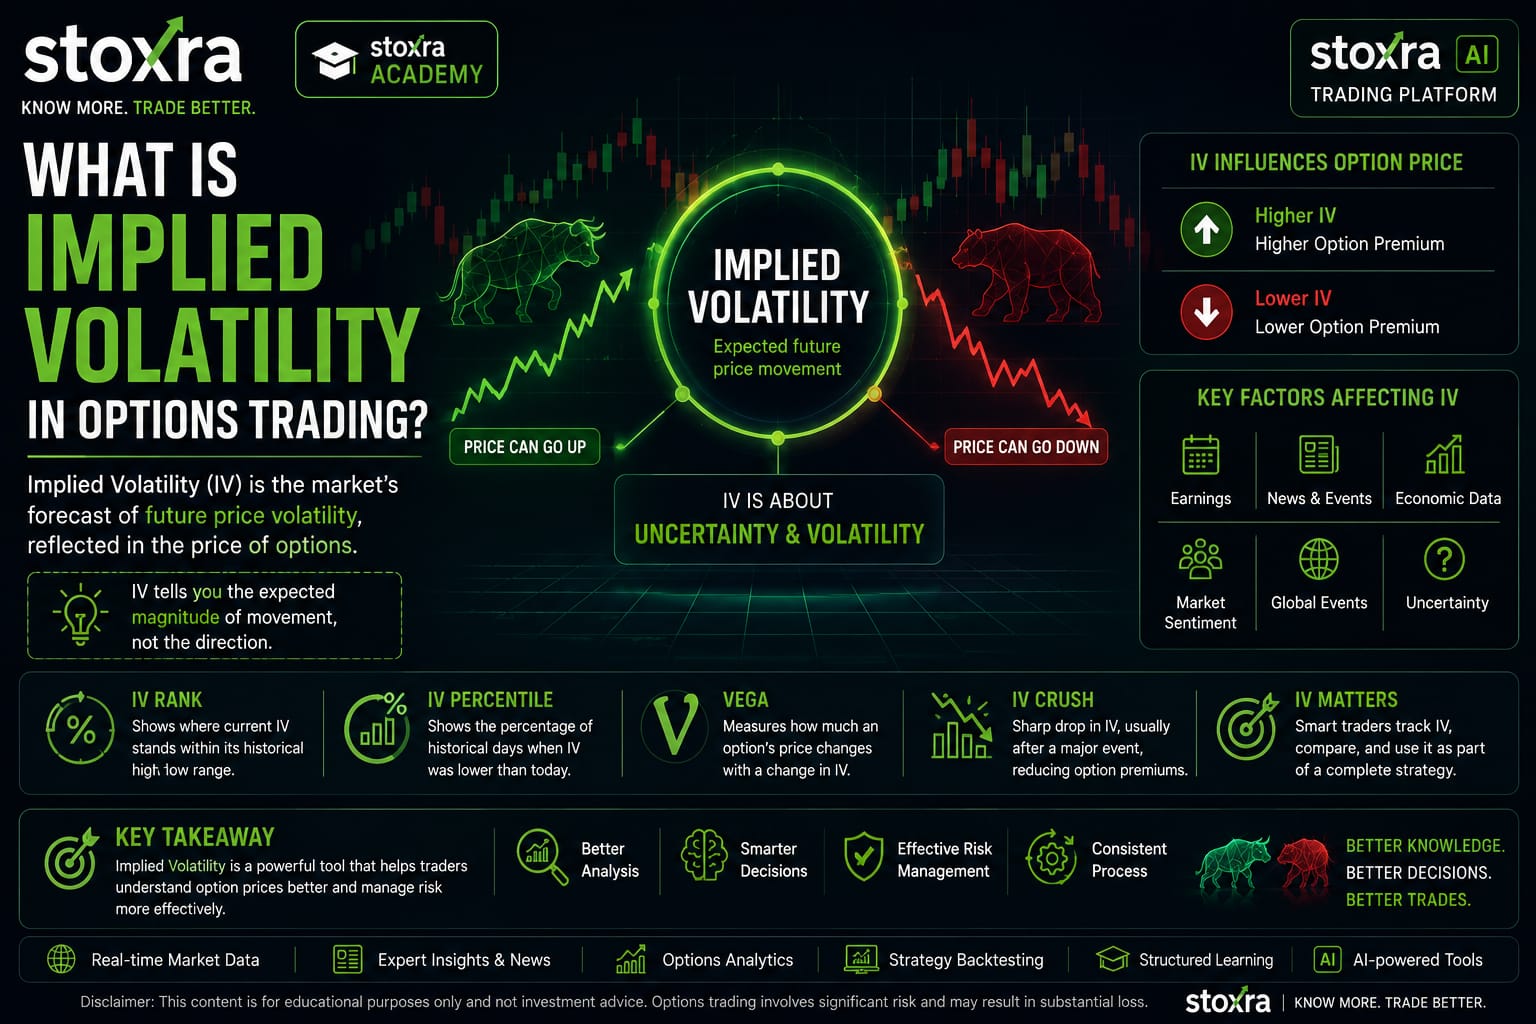
What Is Implied Volatility?
Implied volatility is the volatility level implied by the current market price of an option, based on an option-pricing model and other inputs.
In simple terms, higher IV generally means the market is pricing in a larger potential price movement, while lower IV generally indicates a smaller expected movement.
However, IV does not tell you whether the underlying asset will move up or down. It represents the expected magnitude of movement, not its direction.
This distinction is important because options traders should avoid interpreting volatility as a directional signal. A high-IV call and a high-IV put can both reflect expectations of significant movement without indicating which direction that movement will take.
Why Is Implied Volatility Important?
Option premiums are influenced by several factors, including the underlying price, strike price, time to expiry, interest rates and volatility.
Because volatility is an important component of option pricing, changes in IV can significantly affect option premiums.
This is why two options with similar underlying prices can have very different premiums when their implied volatility differs.
Understanding the difference between buying and selling options is also important because changes in volatility can affect both sides of an options position. Traders can learn more about this through option buying vs option selling risk.
Options traders should also understand the broader risks involved before using volatility-based analysis. A structured approach to options trading risk management can help put IV analysis into a wider risk-management framework.
How Does IV Affect Option Premiums?
All else being equal, an increase in implied volatility generally increases the value of both call and put options because the probability of a larger price movement becomes more valuable to option holders.
Similarly, a decline in implied volatility generally reduces option premiums, assuming other pricing variables remain unchanged.
| IV Condition | Typical Effect on Option Premium |
|---|---|
| IV increases | Option premiums generally increase |
| IV decreases | Option premiums generally decrease |
| High IV | Options may carry higher premiums |
| Low IV | Options may carry lower premiums |
These are general relationships. Actual option prices can also change because of underlying price movement, time decay, interest rates, liquidity and other factors.
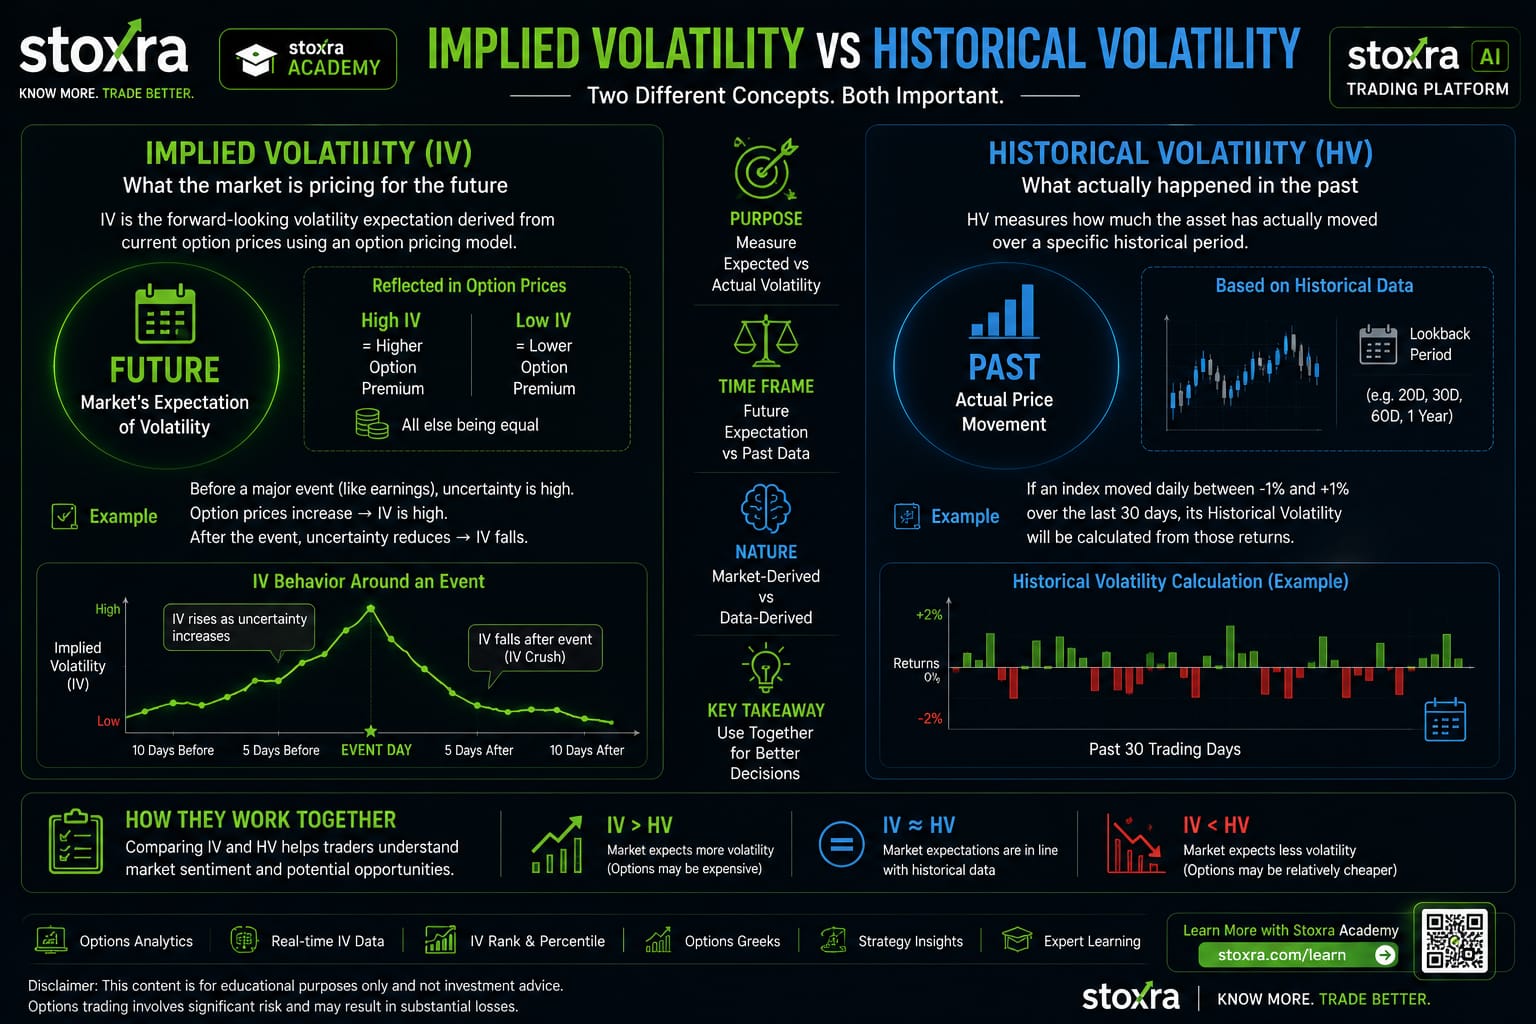
High Implied Volatility vs Low Implied Volatility
High IV
High implied volatility generally means the options market is pricing in greater uncertainty or a larger potential price movement.
High IV can occur around events such as earnings announcements, major economic releases, central-bank decisions or periods of significant market uncertainty.
Low IV
Low implied volatility generally indicates that the options market is pricing in a smaller expected movement.
Low IV does not mean that the underlying asset cannot make a large move. Unexpected news can cause volatility to increase rapidly.
For beginners, it is useful to understand that volatility levels should be evaluated relative to the underlying instrument, expiry and market environment rather than viewed in isolation.
What Is IV Crush?
IV crush refers to a sharp decline in implied volatility after an anticipated event has passed.
For example, suppose traders expect a company to announce quarterly earnings. Before the announcement, uncertainty may cause option premiums and IV to rise.
After the announcement, the uncertainty may disappear. IV can then decline quickly, which can reduce option premiums even if the underlying asset does not move as much as expected.
This is one reason options traders should understand their entry and exit decisions rather than focusing only on the direction of the underlying asset. The STOXRA guide on options entry and exit mistakes provides additional context.
Traders should also be aware that emotional reactions to volatility can influence decision-making. Understanding FOMO and trading mistakes can help traders avoid entering positions simply because premiums or volatility are moving rapidly.
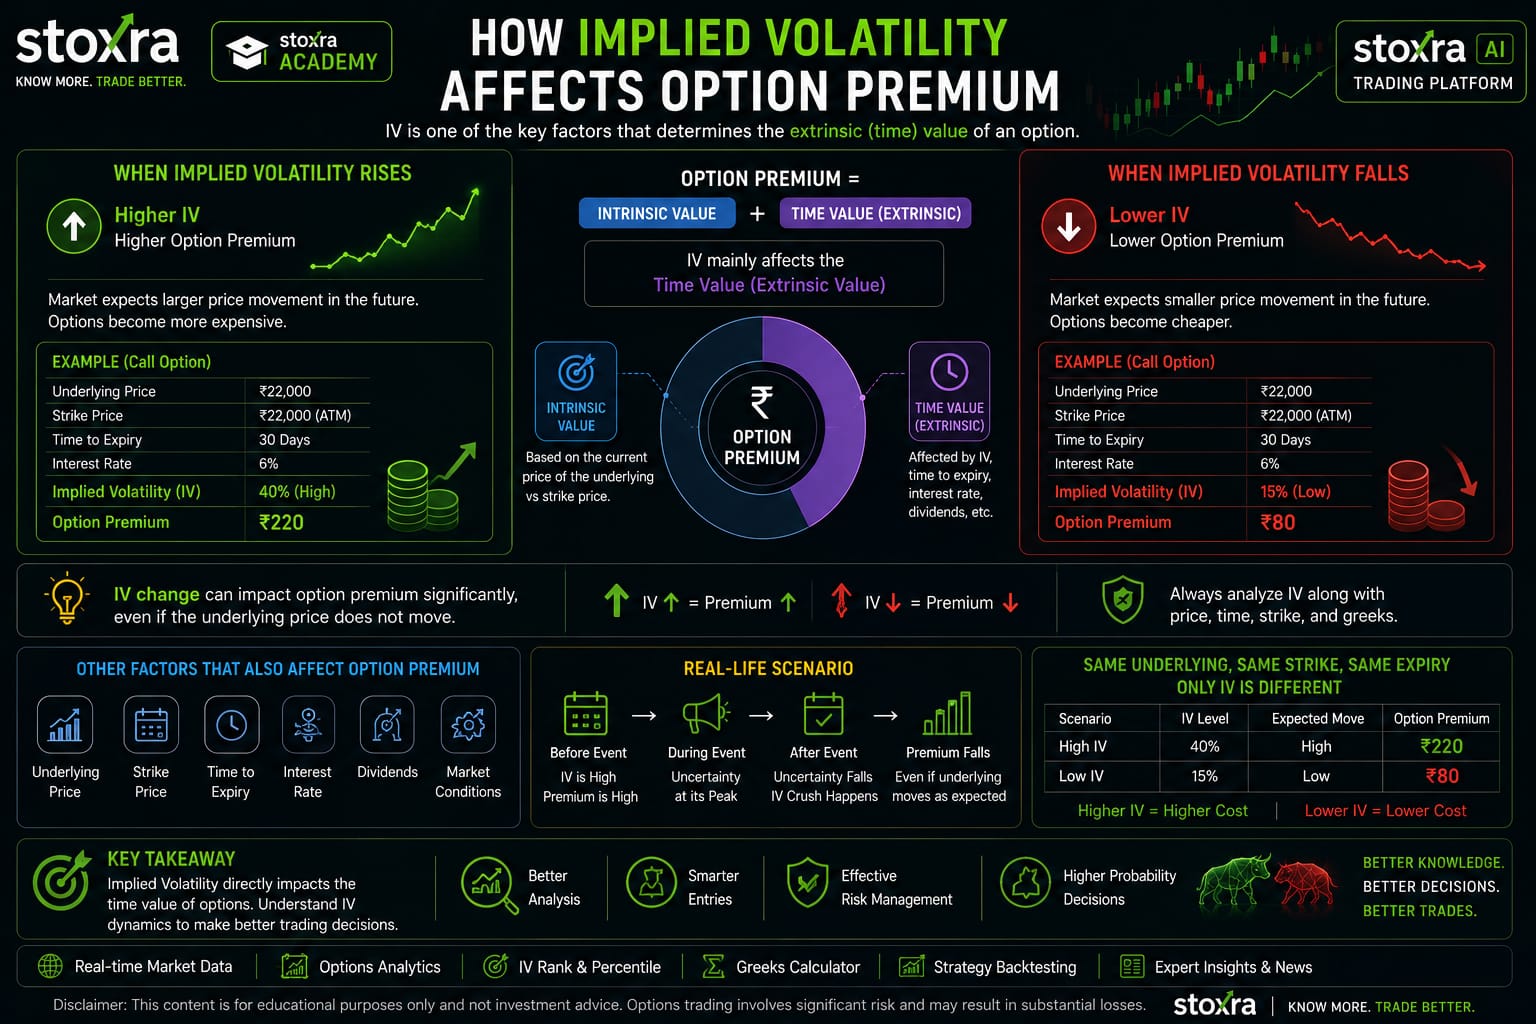
Implied Volatility Before Earnings
Earnings announcements are a common example of an event that can influence implied volatility.
When an earnings announcement is approaching, uncertainty about the company's results may increase demand for options and affect their premiums.
After the announcement, some of that uncertainty disappears. As a result, implied volatility can fall.
This means an option buyer needs to consider not only the direction of the underlying asset but also the potential change in volatility.
The same principle can apply around other market-moving events. Traders should understand the event calendar and consider how changing expectations may affect option premiums.
Implied Volatility and Option Buyers
Option buyers pay a premium to obtain the right, but not the obligation, associated with the option contract.
When IV is high, option premiums may already reflect substantial expected movement. If the underlying does not move enough or IV falls significantly, the option buyer can lose value even when the directional view was partly correct.
Therefore, option buyers should consider both:
- Expected price movement
- Implied volatility
- Time remaining
- Option premium
- Risk of volatility contraction
Because volatility is only one part of an options position, traders should also consider the broader risks involved in options trading. See options trading risk management for beginners for additional guidance.
Position size is another important part of risk control. Traders can review position sizing principles to understand why exposure should be considered before entering a trade.
Implied Volatility and Option Sellers
Option sellers receive premiums in exchange for taking on the obligations associated with the option contract.
Higher IV can mean higher option premiums, which may appear attractive to sellers. However, higher IV also reflects greater expected uncertainty and can therefore come with greater risk.
A high premium should never be interpreted as free or easy profit.
The risk profile can be different for buyers and sellers, which is why understanding option buying and option selling risk is useful before evaluating an options strategy.
Traders should also avoid assuming that a strategy with a high historical win rate is automatically safe. Risk per trade, drawdowns and the size of losing trades remain important considerations.
Implied Volatility vs Historical Volatility
| Feature | Implied Volatility | Historical Volatility |
|---|---|---|
| Based on | Current option prices | Past price movements |
| Focus | Market-implied expectations | Observed historical movement |
| Forward-looking? | Market-implied | Backward-looking |
| Used for | Option pricing and volatility analysis | Historical risk and movement analysis |
The two measures can provide different information. A stock can have relatively low historical volatility while its options trade with high implied volatility because the market expects a future event.
This is why traders should avoid comparing the two measures without considering the time period, instrument and market environment.
What Is the VIX?
The India VIX is commonly used as a broad measure of expected volatility in the Indian equity market. It is based on NIFTY options and is designed to reflect expected market volatility over a specified horizon.
India VIX should not be confused with the implied volatility of an individual option. An individual stock or index option can have its own IV.
For traders analysing NIFTY options, understanding option-chain information alongside volatility can provide additional context. STOXRA also provides resources on how to read option chain data for NIFTY.
Traders can also explore PCR analysis for NIFTY options to understand another type of options-market information.
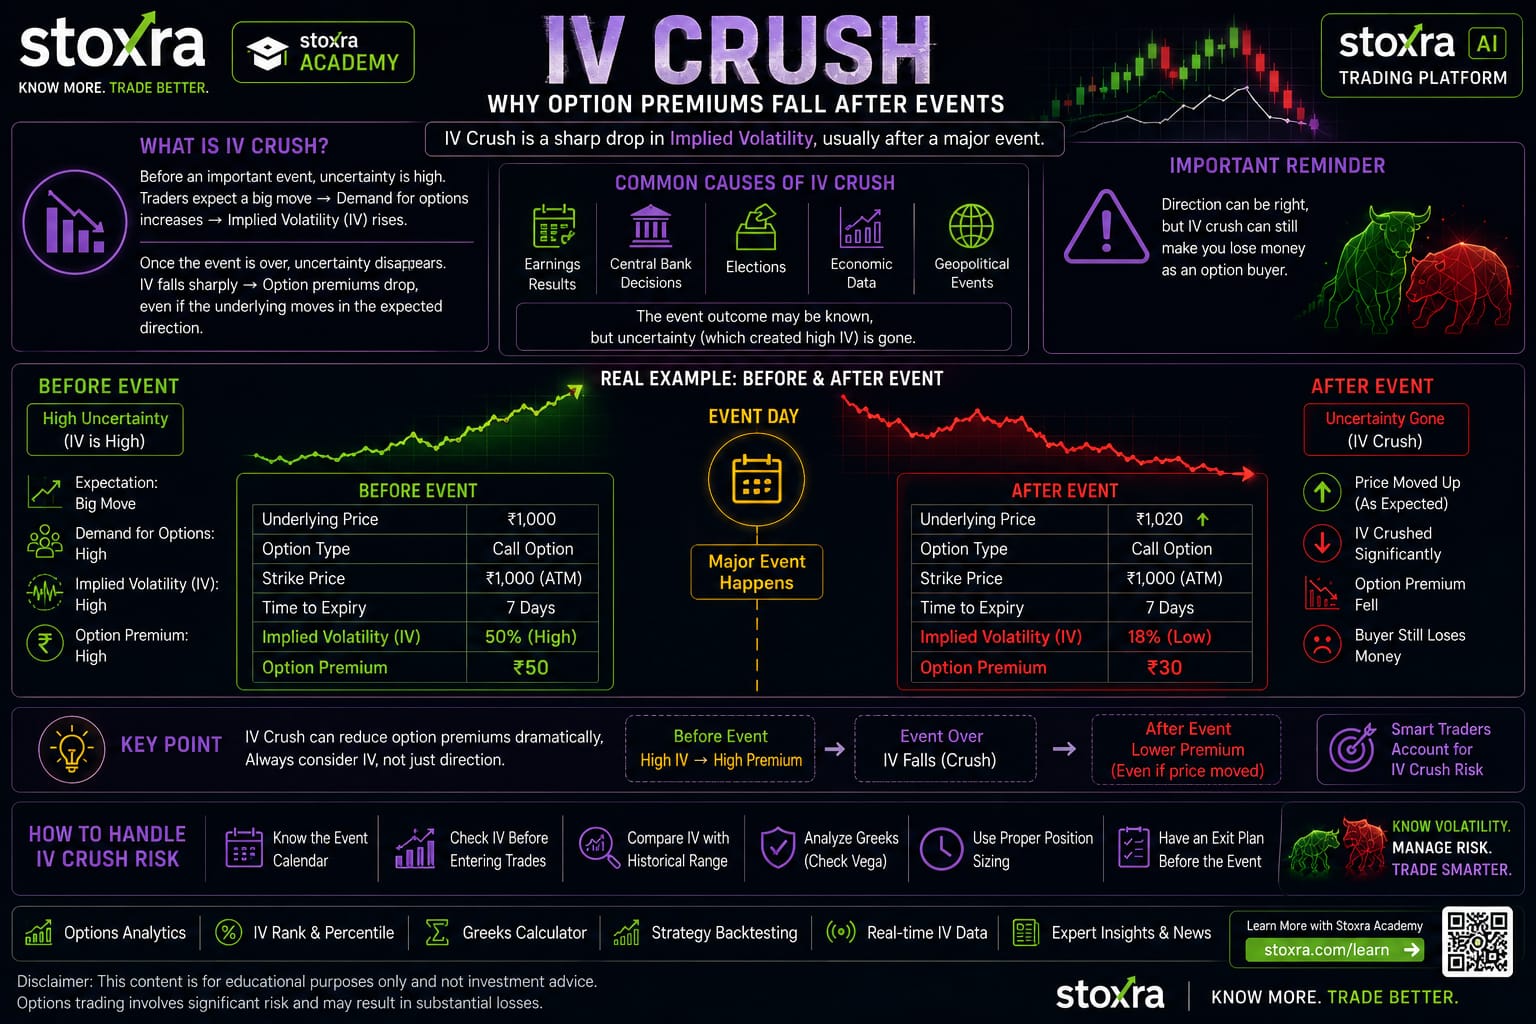
What Is IV Rank?
IV Rank compares the current implied volatility with its historical range over a specified period.
A simplified interpretation is:
- Lower IV Rank: current IV is relatively low compared with its historical range.
- Higher IV Rank: current IV is relatively high compared with its historical range.
The exact calculation can vary depending on the platform and methodology being used. Traders should therefore understand how their data provider calculates IV Rank.
IV Rank can be useful when traders want to understand whether current volatility is relatively high or low compared with the instrument's own historical observations.
What Is IV Percentile?
IV Percentile measures the percentage of historical observations where implied volatility was below the current level during a chosen lookback period.
IV Rank and IV Percentile are related concepts but are not identical.
For this reason, traders should check the methodology used by the platform rather than assuming that the two measures provide exactly the same information.
Implied Volatility and the Greeks
Implied volatility interacts with several option Greeks.
Vega
Vega measures an option's sensitivity to changes in implied volatility. Generally, options with higher vega can experience greater premium changes when IV moves.
Delta
Delta measures the sensitivity of an option's price to changes in the underlying asset, subject to the assumptions of the pricing model.
Theta
Theta represents the sensitivity of an option's value to the passage of time, all else being equal.
Time decay can become particularly important as an option approaches expiry. Traders should therefore evaluate IV together with the remaining time rather than treating volatility as an isolated variable.
Understanding these Greeks can help traders analyse how changes in price, time and volatility may affect an options position.
How Traders Can Use Implied Volatility
IV can be used as one part of a broader options-analysis framework.
A trader may compare:
- Current IV
- Historical IV levels
- Expected price movement
- Option premium
- Time to expiry
- Upcoming events
- Market trend
- Risk-reward profile
This can help traders understand whether an option premium reflects relatively high or low expected volatility.
For NIFTY traders, option-chain analysis can be another useful source of information. You can also read NIFTY option chain analysis and weekly expiry strategy to understand how option-chain data can be incorporated into analysis.
Traders interested in broader options indicators can also explore the best indicators for options trading and understand how different indicators can complement volatility analysis.
Example of Implied Volatility
Suppose a stock is trading at ₹1,000 and a particular option has a premium of ₹40. If market participants become more uncertain about an upcoming event, implied volatility may increase.
If other factors remain unchanged, the option premium may rise because higher volatility increases the theoretical value of the option.
If the event passes and IV falls sharply, the premium can decline even if the stock price does not move dramatically.
This example demonstrates why option traders need to consider both price direction and volatility.
It also demonstrates why a trader should not judge an options position solely by whether the underlying asset moved in the expected direction.
Common Mistakes When Using IV
- Assuming high IV means the stock will rise.
- Assuming low IV means the option is automatically cheap.
- Ignoring upcoming events.
- Ignoring IV crush risk.
- Looking at IV without considering the option's expiry.
- Comparing IV across unrelated securities without context.
- Assuming high option premium means easy profit for sellers.
- Entering a trade without defining the maximum acceptable risk.
Beginners should also avoid making decisions based on a single indicator or metric. A broader understanding of common options mistakes can be found in options trading mistakes for beginners in India.
Traders should also be careful about making impulsive decisions during periods of rapid market movement. Understanding trading psychology can help explain why emotional decision-making can affect risk management.
Implied Volatility and Technical Analysis
IV is primarily an options-market measure, but it can be evaluated alongside technical analysis when building a broader market view.
Technical analysis can help traders study price structure, trend, support, resistance, momentum and other market characteristics.
For a broader introduction, traders can explore technical analysis in stock trading.
Other technical tools can also provide context. For example, VWAP analysis can help traders study the relationship between price and volume during intraday market activity.
Similarly, traders can study candlestick patterns to understand price behaviour around important market levels.
Implied Volatility and AI-Based Market Analysis
Technology can also assist traders in processing large amounts of market information. AI-based systems may combine price data, technical indicators, options information and other inputs to help users organise their analysis.
Traders interested in this area can explore AI tools for stock market analysis in India.
AI should still be treated as a decision-support tool rather than a guaranteed prediction engine. Traders should independently evaluate the information and apply appropriate risk controls.
Readers interested in the wider technology landscape can also explore how AI is transforming stock market trading in India.
How AI Can Help Analyse Options Data
An AI-powered analytical system can potentially process multiple market variables simultaneously.
For example, a workflow could combine:
- Underlying price
- Option premium
- Implied volatility
- Open interest
- Volume
- Technical indicators
- Historical observations
- Market context
The objective should be to provide structured information rather than present an automated output as a guaranteed trading instruction.
Those interested in technology-assisted market analysis can explore the STOXRA AI Trading Platform for a broader view of AI-supported trading workflows.
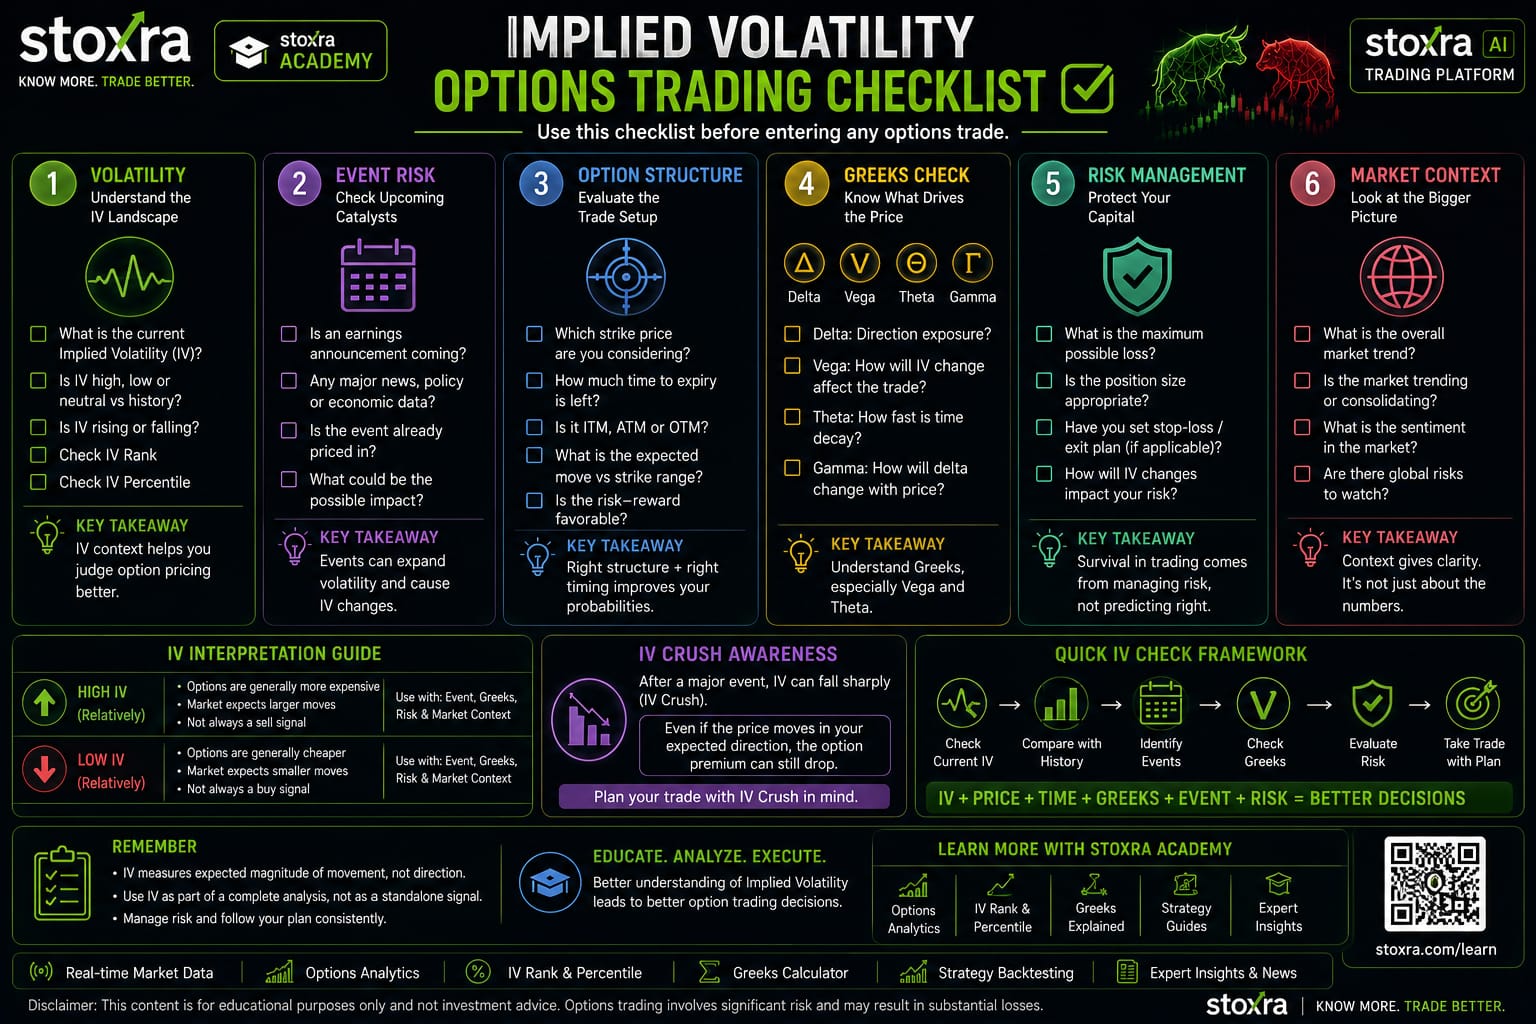
Implied Volatility Checklist
- ☑ Check current implied volatility.
- ☑ Compare it with historical volatility.
- ☑ Check IV Rank or IV Percentile when appropriate.
- ☑ Look for upcoming events.
- ☑ Consider time to expiry.
- ☑ Review option premium.
- ☑ Understand vega exposure.
- ☑ Consider potential IV crush.
- ☑ Review liquidity and market conditions.
- ☑ Evaluate overall risk before entering a position.
A good trading process should also include predefined risk controls. Traders can review intraday risk management for additional practical guidance.
For traders concerned about larger losses and portfolio fluctuations, the principles covered in risk-management techniques for reducing drawdown can also provide useful context.
Final Takeaway
Implied volatility is an important part of options pricing and risk analysis. It reflects the volatility that is implied by current option prices and can change significantly as market expectations change.
Remember:
High IV does not mean bullish.
Low IV does not mean bearish.
IV measures expected magnitude of movement, not direction.
The most useful approach is to combine IV with option pricing, time to expiry, price action, market conditions, upcoming events and proper risk management.
Traders can also review how to identify a strong options trade setup when building a more complete options-analysis process.
Continue Learning With STOXRA
Continue building your understanding of markets, trading concepts and technology-assisted analysis through STOXRA Learn. Traders interested in AI-supported market analysis can also explore the STOXRA AI Trading Platform.
Frequently Asked Questions
What does implied volatility mean?
Implied volatility is the volatility level implied by an option's current market price and the assumptions of an option-pricing model.
Does high IV mean the stock will go up?
No. High IV indicates greater expected movement, not a specific direction.
What is IV crush?
IV crush is a sharp decline in implied volatility, often occurring after an anticipated event when uncertainty decreases.
Is implied volatility the same as historical volatility?
No. Historical volatility is based on past price movements, while implied volatility is derived from current option prices and represents a market-implied expectation.
Why does IV affect option premiums?
Higher expected volatility generally increases the theoretical value of options because larger potential price movements increase the value of the option's payoff potential, all else being equal.
What is the difference between IV Rank and IV Percentile?
IV Rank compares current implied volatility with its historical range, while IV Percentile measures the proportion of historical observations below the current IV during a selected lookback period. Their exact calculations can vary by platform.
Can IV alone be used to choose an option trade?
No. IV should be considered alongside price, time to expiry, option Greeks, liquidity, market conditions, events and risk management.
Can implied volatility be used with technical analysis?
Yes. Traders may combine IV with price action, support and resistance, volume, trend analysis and other technical information. However, combining multiple indicators does not guarantee a profitable trade.
Does high IV always mean an option is expensive?
Not necessarily. IV should be evaluated relative to the underlying instrument, expiry, strike, historical volatility and broader market conditions. A high IV can contribute to a higher option premium, but it is only one factor affecting price.
Disclaimer
This article is for educational and informational purposes only and does not constitute investment, financial or trading advice. Options and derivatives involve substantial risk and may not be suitable for all investors. Implied volatility is a market-based measure and can change rapidly. AI-generated or technology-assisted analysis can also contain errors and should not be treated as a guarantee of future market performance. Always conduct your own research, understand the risks and consider your financial circumstances before making trading decisions.